Exploring Common Winning Lottery Numbers in the UK (2025)
All the information in this page was checked by:
Every piece of information we present is rigorously verified by our team of experts using multiple credible sources, ensuring the highest level of accuracy and reliability.
We have paid partnerships with the online casino operators featured on our site. We may also earn commissions when users click on certain links. However, these partnerships do not affect our reviews, recommendations, or analysis. We remain impartial and committed to delivering unbiased gambling content. For more details, visit our Advertiser Disclosure page.
Common winning lottery numbers in the UK are surrounded by myths, but the truth is that no number is luckier than another. Analysis shows some numbers, like 23 and 38, have appeared more often in recent years, but randomness rules every draw.
- The Luckiest Lottery Numbers From the Last 10 Years
- How Did We Reach This Conclusion? Our Research Methodology
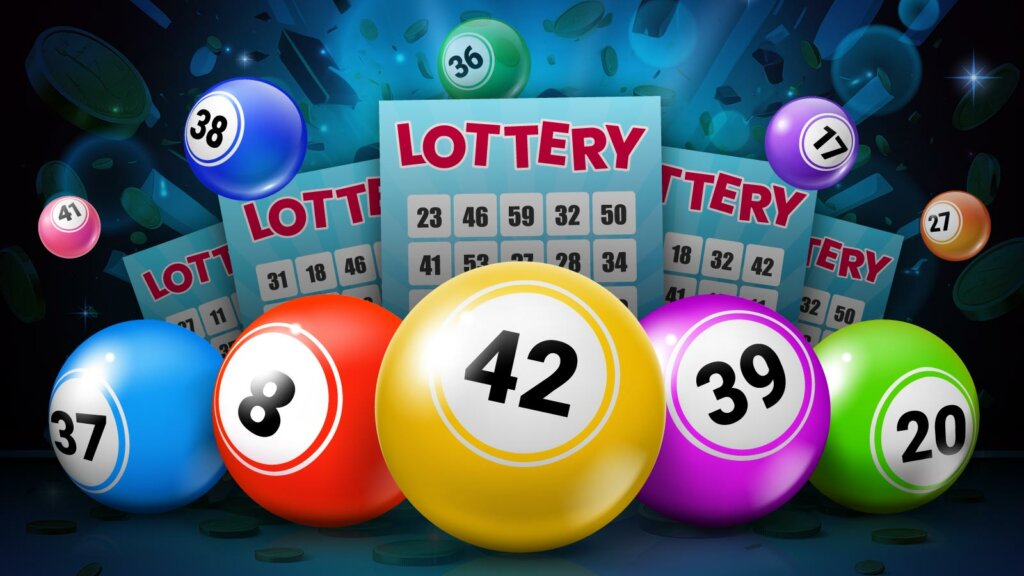
- The Luckiest Lottery Numbers in the Last Decade – 42, 8 and 39
- Another 2 Commonly Drawn Numbers – 37 and 20
- What About Bonus Ball Numbers?
- The 5 Most Drawn Bonus Ball Numbers in the UK
- Should You Buy Multiple Lottery Tickets? Alpha’s Advice
- Final Thoughts on the National Lottery Numbers
The Luckiest Lottery Numbers From the Last 10 Years
| Number | Percentage of Draws |
|---|---|
| 42 | 14.2% |
| 8 | 13.9% |
| 39 | 13.7% |
| 37 | 13.6% |
| 20 | 13.1% |
| 38 | 12.9% |
| 17 | 12.8% |
| 27 | 12.7% |
| 36 | 12.7% |
| 41 | 12.7% |
The highest frequency of occurrence appears for the number 42. There have been 997 Lotto draws since the 3rd of January 2015, and te number 42 has appeared in 14.2% of these events. Our data also shows that numbers in the 30s range have the biggest occurrences. Almost half of the analysed numbers appearing at the top are in this range. 38 also appears as a special case. It was drawn only in 2.6% of the draws we have checked, but it is the most common number randomly drawn for the “Bonus Ball” feature. Our data ending point was the National Lottery draw on Sunday, 20th of July 2024.
How Did We Reach This Conclusion? Our Research Methodology
Our online casino experts have exported all the lucky numbers drawn for the National Lottery events since January 2015, amounting to 997 draws in total. Our main source for data gathering was the official site of the National Lottery, lottery.co.uk. We then have organised the numbers in a statistics database to see which numbers have the highest frequency when drawn, which have a median presence and which are the rarest.’ Once we extracted the data for the normal sequence, we also checked what number was most often drawn at random for the Bonus Ball feature. Have a look at our detailed research process:
| Step | Description | Tools/Resources Used | Data Analyzed |
|---|---|---|---|
| Data Collection | Gathered winning numbers from major lotteries worldwide | Historical records from official lottery sites | Winning numbers from last 10 years |
| Filtering Criteria | Selected numbers from top lotteries | National Lottery, EuroMillions, Powerball, etc. | Most frequent winning numbers |
| Frequency Analysis | Analyzed how often each number was drawn | Statistical software, manual analysis | Frequency of individual numbers |
| Probability Assessment | Calculated probabilities based on number appearances | Probability calculators | Likelihood of future draws |
| Final Report | Compiled results into readable insights | Data visualization tools | Most common winning numbers |
The Luckiest Lottery Numbers in the Last Decade – 42, 8 and 39
We have uncovered that 42 appears most frequently at the random draws of the National Lotto events. Of the 997 total winner announcements, the number 42 has appeared 142 since July 2024. It could be considered the luckiest number in history, but it is important for us to note that all the draws happen via a randomising system, and this is just a statistical coincidence with a rate of just 14.2% from 100%.’ Number 8 has the second most common frequency of occurrence. We have calculated its percentage to be at 13.9% appearance from the start of 2015 until July 2024. Number 39 comes in third place. It was drawn 137 times out of the almost 1000 picks, which gives it a 13.7% occurrence rate.’
Another 2 Commonly Drawn Numbers – 37 and 20
Number 37 stands 4th in our statistical ranking. It has an occurrence rate of 13.1%, which makes it very close to a top 3 spot. Our odd specialists have noted that this is a case of a larger phenomenon where the unit most drawn is made up of numbers from 30 to 39. It appears that the 30s range could be considered the luckiest, by a mathematical average, even in the random system of the National Lottery. Number 20 lands on the 5th spot in our team’s ranking. It has been drawn significantly more than other numbers that have landed below, with a frequency rate of 13.1%.
What About Bonus Ball Numbers?
| Number | Percentage of draws |
|---|---|
| 38 | 2.6% |
| 12 | 2.5% |
| 42 | 2.5% |
| 48 | 2.4% |
| 17 | 2.3% |
The Bonus Ball feature is an advantage that players can use to increase the amount of money they win on their ticket. The term for such perks in the National Lotto games is a “cash-boosting ball”. Our team has discovered that, on average, all the most common numbers randomly picked for Bonus Ball have a significantly lower percentage, all of them under 3%.
The 5 Most Drawn Bonus Ball Numbers in the UK
The number one most often seen number as the cash-booster ball is 38. Again, this is in line with what our experts have noted: the 30s range has the highest occurrences in all the draw types available. 38 has appeared 26 times in all the 997 draws, with a rate of 2.6%. The next numbers we have extracted from our statistics are both tied at the same rate of 2.5%. Numbers 12 and 42 are the contenders next in line as “luckiest” Bonus Balls random picks. Number 48 has a 2.4% occurrence rate, just 0.1% of a difference from 12 and 42. The chances here do not differ that significantly, but when the winning sequence is revealed, practically, it could make all the difference. Lastly, number 17 also lands an impressive spot in our Bonus Ball ranking as well. From the total of 997 draws we analysed, it appears in 2.3% of cases as the booster feature.
Should You Buy Multiple Lottery Tickets? Alpha’s Advice
- Increased Probability: Buying more tickets slightly increases your odds of winning by giving you more combinations in the draw.
- Diminishing Returns: While buying more tickets improves your chances, the improvement is often small compared to the overall odds.
- Group Play (Syndicates): Pooling tickets with others can also improve your chances collectively, though winnings may need to be shared.
- Cost Considerations: It’s essential to balance the number of tickets with how much you’re willing to spend, as buying too many tickets can increase costs quickly.
For a detailed breakdown, explore our guide on how multiple lottery tickets affect your odds.
Final Thoughts on the National Lottery Numbers
We at CasinoAlpha have a mission to inform gamblers about their best tools and techniques for any sort of gambling-related activity. We are aware of lottery games and how popular they are in the United Kingdom, and we have shown how mathematical insights can give players a glimpse into how randomised picks look over a period of almost a decade. Our CEO, gambling specialist Tudor Turiceanu, commented: “Although every lottery draw is unique, and there is no surefire way to ensure you pick the winning numbers, the study reveals an interesting insight into the numbers that have been drawn most often. For those hoping to add an element of certainty into their lottery picks using this knowledge, unfortunately, the fundamental odds of the game do not change no matter how many times a number has appeared. Yet, this doesn’t dampen the rush of the game—every ticket holds the potential for a life-changing win.’ While the odds don’t change, knowing the most drawn numbers can give the feel of a strategic edge and make your choices feel more purposeful rather than random.”


