
London Knife Crime Statistics: What Are Your Chances of Getting Stabbed in London?

All the information in this page was checked by:

Every piece of information we present is rigorously verified by our team of experts using multiple credible sources, ensuring the highest level of accuracy and reliability.
In London, there are more than 36 stabbings reported per day, marking a 21% increase in knife crime compared to the previous year. The capital city is responsible for a quarter of all knife-related offenses in England and Wales, despite a decrease in stabbing incidents in other areas. The rise in knife crimes related to sexual assault and robbery is particularly concerning, prompting urgent demands for authorities to tackle the escalating crisis of blade violence.
- Must-Know UK Stabbing Statistics
- Where London Stands Now: Current Knife Crime Rates
- London Knife Crime: Where, Why, and Who?
- Why is There so Much Knife Crime in London?
- Is London UK’s Murder Capital?
- Knife Crime Statistics Across Time
- When did Knife Crime Start in the UK?
- Which Part of the UK Has the Highest Knife Crime Rate?
- Are You at Risk of Getting Stabbed?
- How Can Knife Crime be Stopped?
- CasinoAlpha’s Methodology
- References
Must-Know UK Stabbing Statistics
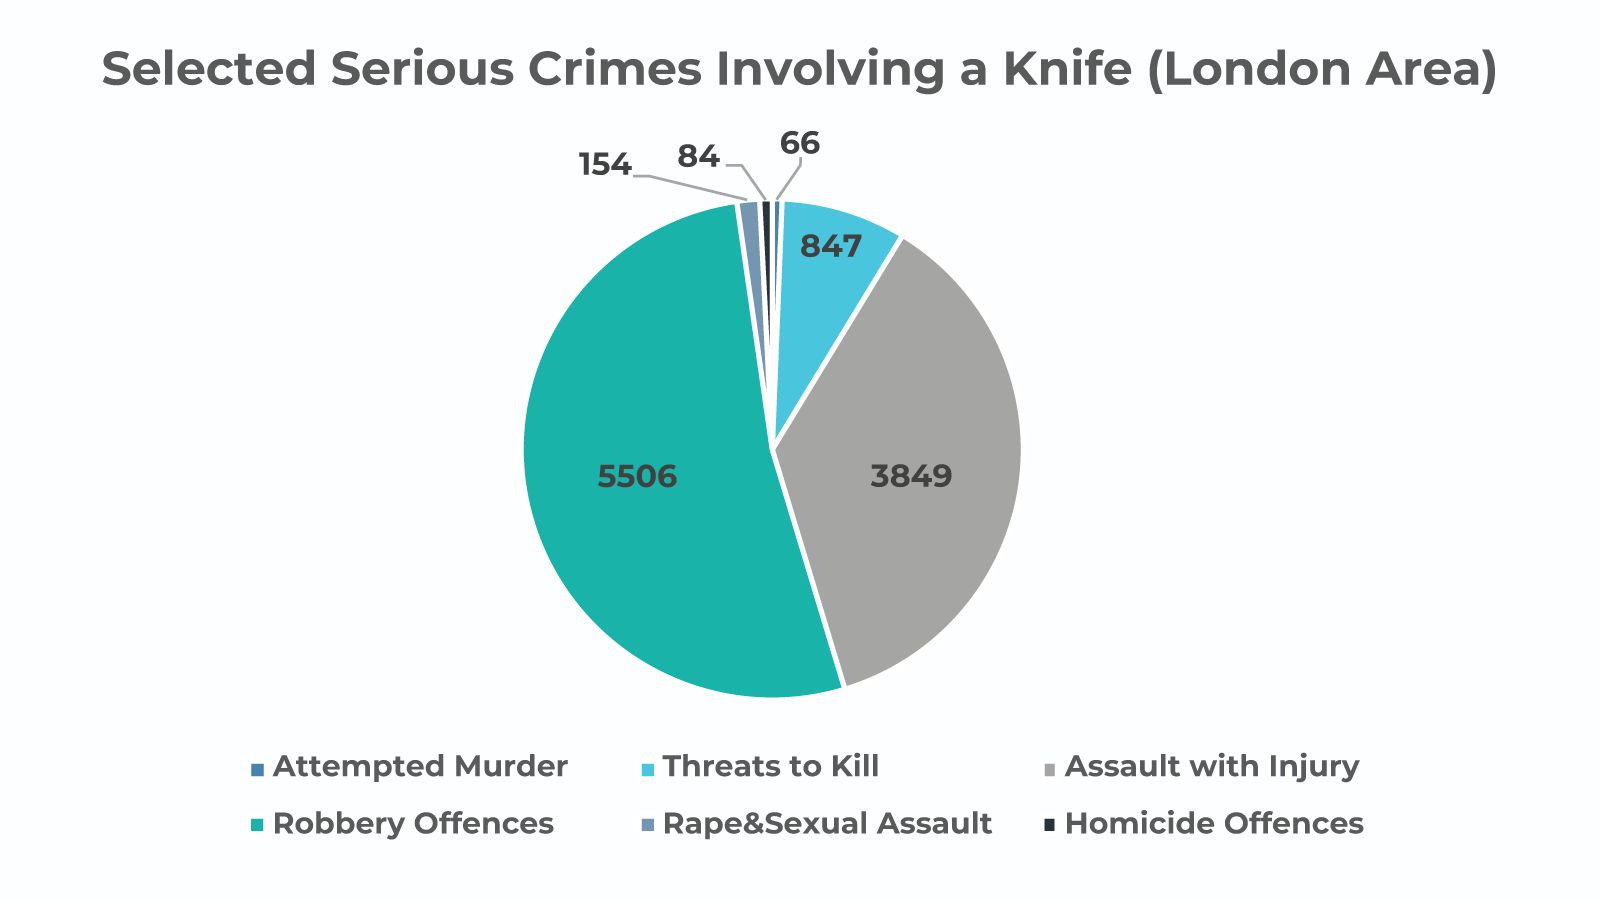
- Knife offences rose 21% in year to June 2023, reaching 13,503
- This equals around 37 stabbings per day on average
- Knife-point robberies jumped 36% to nearly 8,000 offences
- Knife rapes/sexual assaults increased 27% to 231 crimes
- But knife killings fell 16% to 65 homicides
- Attempted murders with blades rose from 53 to 64
- Total knife crime up 49% since 2016 mayoral election
- 21% rise outpaces national falls of 5-16% in other big cities
- London accounts for around a quarter of all UK knife offences
- Knife possession convictions neared 19,000 last year
What is knife crime?
It is an umbrella term for violent offences where the implicated parts use knives or similar sharp objects as weapons.
We will use the term for all such contraventions, whether they resulted in fatalities or injuries. We will highlight the differences in outcome between the London stabbings where it is relevant.
Disclaimer
We investigate the London knife crime statistics and facts to find the main contributing factors and provide advice on how to avoid falling victim to a London stabbing. The truth behind this horrendous crime’s mythologisation is an interweaving of class, race, gender, and generational differences. Our objective presentation of London knife crime statistics intends to remove the stigma and contribute to a long-lasting solution.
Assessing the likelihood of knife crime in London
Is there a sensible way of asking, “What are the chances of getting stabbed in London?” Yes, as long as we approach the issue of knife crime responsibly and unbiasedly.
The online casino experts from CasinoAlpha have accumulated considerable experience in the world of gambling. Thus, they are accustomed to assessing statistical data and performing risk management analyses.
Where London Stands Now: Current Knife Crime Rates
London continues to suffer a knife crime epidemic, with offences involving blades surging 21% over the past year.
The capital accounted for over a quarter of all such crimes across England and Wales, even as other major cities saw drops. There were 13,503 knife crimes in London in the 12 months ending June 2023 – an average of over 36 per day.
London bears a disproportionate burden of England and Wales’s knife violence crisis. Over the periods reported, the capital accounted for approximately 25% of all recorded knife offences across the two countries. This is an especially large share, considering London’s population is only about 15% of the two countries combined. Meanwhile, knife possession convictions neared 19,000 nationally last year.
Disclaimer
All the presented London knife crime statistics data comes from trusted official sources.
What are the motives behind London’s stabbing crimes?
While no single reason explains London’s surge in knife attacks, data points to a mix of gang activity, robbery, and interpersonal disputes.
Criminologists describe complex social roots like poverty, absent fathers, cuts to youth services, and a lack of economic opportunities. Authorities also cite the widespread availability of kitchen knives and online videos glorifying violence as contributing factors behind the ongoing tragedy.
London stabbing events vs other violent offences
London saw a concerning surge in stabbing incidents, with knife offences rising to 12,786 in 2022/23, marking the highest number since 2019/20.
This spike contrasts with the trend of other violent offences, such as sexual assaults and robberies, which either decreased or remained relatively stable during the same period. The prevalence of knife-related crimes underscores a pressing challenge for law enforcement and policymakers in addressing the root causes of violence in the city.
Other weapons used in London attacks
In addition to knives, other weapons have been employed in attacks across London, contributing to the city’s overall crime statistics. The rise in knife offences to 12,786 in 2022/23 reflects just one aspect of a broader trend of violence involving various weapons.
Instances of acid attacks, for example, surged from 51 in 2007 to 472 in 2017, highlighting the multifaceted nature of violent crime in the city. Similarly, moped crime peaked in 2017, illustrating the diverse methods perpetrators use in carrying out criminal activities.
Crime and homicides in London
Crime and homicides in London have exhibited alarming trends in recent years, with knife-related incidents comprising a significant portion of violent offences.
The rise in knife homicides to 282 in 2021/22 from 186 in 2014/15 underscores the severity of the issue. Notably, knives were utilised in over 40% of homicides in 2021/22, emphasising the urgent need for comprehensive strategies to address the root causes of violent crime in the city.
Key takeaways
- Knife crime in London surged by 16% in the 12 months ending March 2022 compared to the previous year, reaching 12,786 offences
- London accounted for about a quarter of all knife crimes in England and Wales over this period.
- In the year ending September 2023, knife offences increased by 5%, totalling 48,716, with possession of bladed articles rising by 10%
- In the year ending June 2023, knife-enabled crimes in London rose by 21%, knife-point robberies surged by 36%, and knife-related rapes and sexual offences increased by 27%
- Knife killings decreased by 16% to 65, while attempted knife murders rose from 53 to 64
- The rise in London knife offences contrasts with drops in the West Midlands (5% decrease) and Greater Manchester (16% decrease)
- The Mayor has implemented measures such as offering knife wand metal detectors to all secondary schools in London to tackle knife crime.
- Nationally, there were 50,500 offences involving sharp instruments in England & Wales in the year ending March 2023, a 4.7% increase from the previous year.
- Hospital admissions for assault by a sharp object totalled 3,768 in England to September 2023, with a 4% decrease compared to the previous year but a 9.5% increase compared to 2014/15
- Despite fluctuations, there has been a consistent rise in knife crime and homicides in London over recent years, necessitating comprehensive strategies to address the underlying causes of violence.
London Knife Crime: Where, Why, and Who?
To better understand London’s stabbing statistics, we will explore their underlying factors. Here are the essential facts about London knife crime and its causes.
What borough has the highest knife crime rate?
Westminster emerges as the London borough with the highest knife crime rate, with 1,007 knife crime offences recorded in the past year, surpassing other areas like Croydon and Newham. The borough has seen a significant increase in knife-related incidents, with offences involving sharp instruments rising by almost 30% this year alone.
Despite efforts from the Metropolitan Police, including targeted deployments and community engagement, the surge in knife crime underscores the ongoing challenge of addressing violence and ensuring community safety in Westminster.
Where is knife crime highest in London?
Westminster has the highest rate of knife crime in London, with 3.6 incidents per 1,000 residents. The Metropolitan Police recorded 1,007 knife crime offences in Westminster over the past year, indicating a troubling increase in incidents like stabbings and personal robberies.
This surge in sharp instrument-related offences coincides with a 15.1% rise in knife crime across Greater London, with 14,452 offences documented in the last 12 months. Despite law enforcement’s efforts to combat the problem by deploying officers to known hotspot locations and carrying out high-visibility patrols, knife crime remains a significant challenge to community safety in Westminster and throughout London.
Men vs women

Knife crime is highly gender-dependent. No less than 97.1% of killers are men, according to London stabbing figures.
Additionally, men are more likely to fall victim to a London stabbing, with 80% of those slaughtered being male. This difference is even more damming, considering that the population of women is larger than that of men within Greater London.
The discrepancy highlights a secondary dynamic beyond painting London knife crime as an essentially male-on-male act of violence.
While women perform a marginal part of London stabbing events, they fall victim to a fifth of them. Thus, beyond the common associations to gang violence, burglary, and economically motivated crime, stabbings also decidedly play a part in gendered violence.
Women are more likely to be killed by someone in their inner circle
31% of the victims were assaulted by their partner’s or ex-partner’s attack. 20.7% were killed by a family member.
Street and domestic violence
They are more likely to die “on the street”, while women most often fall victim “at home” to a relative or (past) partner.
An even more unfortunate fact, and perhaps indicative of another key aspect: 48.2% of all female victims were already or soon-to-be mothers.
What are your chances of being stabbed in London depending on gender?
Men die younger, especially in the case of London stabbing victims. The average for men is 31 years and 39 years for women.
Considering that the age means for Greater London residents is 35.3 years for men and 36.5 for women, males often face attacks early in life. In contrast, women tend to fall victim to knife crime later in life.
Unfortunately, there were numerous instances where the victims were not only underage but still toddlers, with three victims considered for London knife crime statistics being younger than one year old.
The most decisive factor is social class
The most significant factors in committing and being a victim of a London stabbing are related to class, societal, and community influences. Surprisingly, these factors are often overlooked when addressing the problem of knife crime. The most comprehensive research on this topic comes from BMC Public Health, which aims to identify risk factors associated with weapon-related crime in young people in the UK by analyzing a wide range of existing literature.
Three important conclusions
- The review found no association between gender or ethnicity and youth violence
- Several research papers identified adverse childhood experiences and poor mental health as positively associated with youth and gang violence
- Multiple studies suggested that community and societal risk factors (discrimination, economic inequality) are frequently linked to such violence
It seems that context is more important than any other consideration regarding the perpetrators of knife crime. Any other consideration regarding boroughs, gender, and demographic belonging is just a partial indicator of the true cause behind the London stabbing epidemic.
Why is There so Much Knife Crime in London?
Most studies correctly identify antisocial behaviour as the primary condition in direct correlation with violent crime. However, such characteristics evolve from a traumatising developmental environment.
More than the aspect of an unfortunate upbringing, constant societal risk factors maintain and perhaps even add to the pressure that so often explodes into another fit of fatal knife crime.
How does knife crime affect the community?
As the issues that led to the London stabbing epidemic go unaddressed (or poorly addressed), violence plays back into the loop, enforcing the environment that generated it. The criminals, victims, and their underlying environment remain in an endless cycle of violence, uninformed media vitriol, and failures to appropriately address real issues.
Key takeaways
- The risk and tide of London knife crime are not evenly distributed across London’s population.
- Certain boroughs have historically been linked to increased rates of violent crimes.
- Men perform nearly all knife-related crimes. While they are also the likeliest to be attacked, 20% of the victims were women.
- Partners, ex-partners, or family members often attacked women. Almost half of the female victims were mothers or pregnant at the time of the attack.
- The only positively correlated aspects leading to violent crimes are poor mental health, adverse developmental environment and societal risk factors like discrimination and economic inequality.
- Mass media does an infamously poor job of addressing the actual situation behind the London knife crime.
Is London UK’s Murder Capital?

The recent stabbing incidents in London highlight the prevalence of violent knife crime in the UK’s capital. It’s important to compare its crime rates with those in other regions. Greater London had twice the number of killings per capita compared to the rest of the UK. Additionally, we need to consider historical trends and determine if the record-breaking teen homicide rates from last year indicate a more widespread issue regarding knife crime rates in London.
Knife Crime Statistics Across Time
The first peak in London stabbing rates occurred between 2011 and 2012, with roughly 14000 recorded incidents.
Overall offences
The numbers decreased in the following years, reaching an all-time minimum between 2014 and 2015, with 9700 cases. The number of knife crimes steeply rose in the next years, reaching record highs of around 15600 cases in 2019-2020.
The first pandemic year lowered offence rates, but we may be looking toward a new statistical peak given the explosion in recent London stabbing events. Between 2022 and 2023, a total of 12,786 knife offences alone were reported.
Cases that resulted in injury
According to the data, NHS Digital recorded 3,775 hospital episodes in England in 2022/23 due to knife crime offences. These incidents represent individuals who suffered injuries as a result of knife-related incidents, highlighting the serious consequences of such crimes on public health and safety.
We do not have any data for the current year. Still, considering the historical spike in teenage homicides across the city’s boroughs, we can safely assume that offences resulting in an injury have risen according to the overall cases.
London, in context
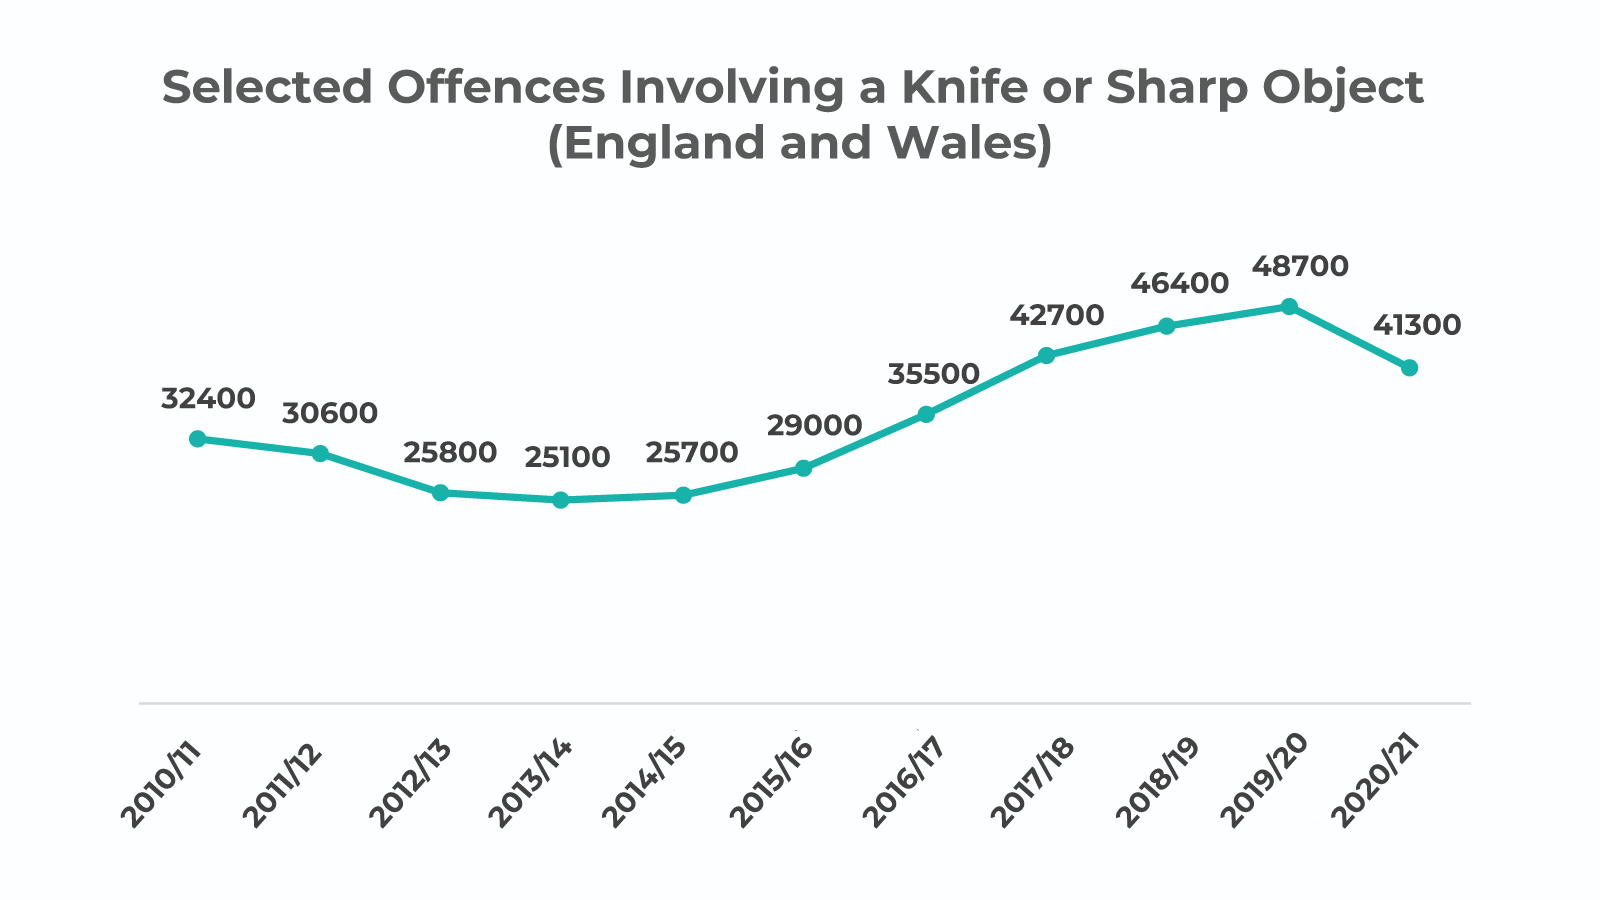
The rise in knife crime in London is not an isolated issue but reflects similar trends in England and Wales as a whole. In the early 2010s, the Metropolitan area was a major hotspot for violent offences, accounting for a significant portion of cases in the region. However, in recent years, the distribution of crime rates has become more widespread. While London still has high stabbing rates, it is no longer among the top two areas with the highest rates.
Based on statistics from 2010-2011, the West Midlands and Greater London were the only areas with over 100 offences per 100000 residents, while all other regions had fewer than 77 cases. The number of knife crimes in London decreased to under 118 cases within the Metropolitan area, with the West Midlands and specific areas such as Middlesbrough, Hartlepool, Stockton-on-Tees, Redcar and Cleveland becoming new hotspots for such offences. The overall spread of knife crime rates across counties corresponds to a regional increase in overall cases.
The motives for crimes have also changed significantly over the years. While knife crime has traditionally been associated with assaults resulting in injury, offences have shifted to threats to kill, attempted murder, and sexual assaults and offences.
In recent years, London has experienced notable fluctuations in its crime landscape. Knife crime remains a pressing concern, with the city witnessing a surge in offences, reaching 12,786 in 2022/23. Despite efforts to curb violence, including initiatives like offering knife-wand metal detectors to schools, the prevalence of knife-enabled crimes continues to challenge law enforcement agencies.
Additionally, while overall crime rates have fluctuated, specific offences such as anti-social behaviour, shoplifting, and vehicle crime persistently impact communities. Moreover, disparities in crime rates across boroughs highlight the complex interplay of socioeconomic factors, with areas of higher deprivation often facing higher incidences of crime. Addressing these challenges requires a multifaceted approach, encompassing community engagement, targeted law enforcement strategies, and investment in social programs to tackle the root causes of criminal behaviour and ensure the safety and security of all Londoners.
While these last years saw minor knife-related criminality across all categories, comparisons with earlier dates paint a bleak picture: England is becoming more violent.
When did Knife Crime Start in the UK?
Armed assault has been present in Great Britain for as long as there are records to show it. However, just like the recent London stabbing epidemic, steep increases are a modern phenomenon.
Most recent UK crime rate data
| Crime | October 2023 | Rate (per 1,000 people) | November 2023 | Rate (per 1,000 people) | December 2023 | Rate (per 1,000 people) |
|---|---|---|---|---|---|---|
| Anti-Social Behaviour | 73,905 | 1.23 | 63,328 | 1.06 | 54,584 | 0.91 |
| Bicycle Theft | 6,358 | 0.11 | 4,886 | 0.08 | 3,529 | 0.06 |
| Burglary | 20,848 | 0.35 | 20,495 | 0.34 | 20,789 | 0.35 |
| Criminal Damage and Arson | 37,176 | 0.62 | 35,695 | 0.60 | 32,764 | 0.55 |
| Drugs | 12,343 | 0.21 | 12,460 | 0.21 | 11,908 | 0.20 |
| Possession of Weapons | 4,205 | 0.07 | 3,848 | 0.06 | 3,683 | 0.06 |
| Public Order | 36,130 | 0.60 | 32,652 | 0.54 | 29,050 | 0.48 |
| Robbery (inc. mugging) | 6,123 | 0.10 | 6,390 | 0.11 | 6,279 | 0.10 |
| Shoplifting | 34,913 | 0.58 | 33,274 | 0.56 | 29,133 | 0.49 |
| Theft From the Person | 9,775 | 0.16 | 12,195 | 0.20 | 11,738 | 0.20 |
| Vehicle Crime | 31,454 | 0.52 | 30,566 | 0.51 | 27,390 | 0.46 |
| Violence and Sexual Offences | 162,744 | 2.72 | 157,237 | 2.62 | 154,737 | 2.58 |
While some crimes, like anti-social behaviour and shoplifting, show a gradual decrease over the months, others, such as burglary and vehicle crime, remain relatively stable. However, it’s concerning to note the persistently high rates of violence and sexual offences throughout this period, highlighting the continued challenges in addressing such crimes effectively.
This data underscores the importance of ongoing efforts in crime prevention and law enforcement to ensure the safety and security of communities across the UK.
Which Part of the UK Has the Highest Knife Crime Rate?
England and Wales have seen higher knife-related homicide rates during the late eighties and the nineties. However, the rates seen between 2001 and 2007 have been undisputedly the highest until recent times.
Scotland, however, saw its highest violent crime rates between 1991 and 2005, after a slow but constant increase since 1973. Its more extensive history with violence changed its approach to tackling criminality.
Crime rate per city
| City | Crime Rate (per 1,000 people) |
|---|---|
| Leeds | 51 |
| Hull | 43 |
| Newcastle | 42 |
| Nottingham | 41 |
| Bradford | 39 |
| Manchester | 38 |
| Southampton | 36 |
| Birmingham | 36 |
| Leicester | 35 |
| Cardiff | 34 |
Leeds has the highest business crime rate, at 51 incidents per 1,000 people, followed closely by Hull, with 43, and Newcastle, with 42. Nottingham and Bradford also experience significant rates of business crime, at 41 and 39 incidents per 1,000 people, respectively.
These findings underline the importance of implementing robust security measures, such as securing doors and windows, hiding expensive items, and maintaining outdoor security to mitigate the risk of business crime across the UK.
Is knife crime worse in London compared to Glasgow?
When comparing safety between Glasgow and London, the data reveals distinct differences. Glasgow has a lower crime index at 45.11 compared to London’s 54.47, indicating a relatively safer environment. However, London reports a higher Safety Scale at 45.53, contrasting Glasgow’s 54.89. London experiences fewer worries about home break-ins (47.89% compared to Glasgow’s 37.96%), car theft (43.92% compared to Glasgow’s 30.39%), and theft from cars (50.59% compared to Glasgow’s 37.46%).
Conversely, Glasgow boasts higher safety perceptions for walking alone during daylight (69.74%) than London (64.37%). However, London faces greater concerns regarding safety during nighttime strolls, with only 38.31% feeling safe, while Glasgow records a moderate safety level at 41.95%. Both cities encounter moderate to high levels of worries related to assaults, drug-related problems, and violence, underscoring ongoing challenges in urban safety management.
How did Glasgow reduce knife crime?
After being dubbed the “murder capital” of Europe by the World Health Organisation (WHO), the Scottish Violence Reduction Unit (SVRU) was launched in 2005 by Strathclyde Police in response to high rates of homicide and gang violence.
A comprehensive approach
- The Unit effectively managed to address and reduce violent crimes by interrogating and tackling the concrete, fundamental causes of the problem
- Its campaign united the efforts of law enforcement, social services, and other bodies, including associations such as Medics Against Violence
- The group lobbied for legislative changes around armed violence, efforts that resulted in more stop-and-searches and a tripling of the average sentence
SVRU’s method
The Scottish Violence Reduction Units performed a miracle in communicating with possible offenders. The message was twofold. On one side, authorities warned gang members that police officers would intervene much more heavily than before. All members were at risk of arrest and sentencing.
On the other side, the SVRU dedicated considerable resources to portraying the risks of violent criminality and providing a way out of the cycle of aggression.
Youth work and positive prevention became critical elements of the approach. Authorities offered new opportunities for possible perpetrators and incited positive change via their communications campaigns.
And it worked. The SVRU did its job. Between 2006 and 2011, the number of minors who died due to knife-related assaults fell to 15. The number further decreased between 2011 and 2016 to only eight. Additionally, the number of people carrying knives fell from 10110 in 2006-07 to 3111 in 2015-16, amounting to a 69% decline.
Are You at Risk of Getting Stabbed?

Our analyses of London stabbing rates and the national context should inform a change in attitude towards knife crime.
What are the chances of getting stabbed in London? They remain higher than in many other areas of the UK and beyond. However, this is true mainly for the vulnerable populations they stem from.
The average Londoner is more likely to die in vehicle-related events. In 2022 alone, London recorded over 23,500 road collisions, leading to approximately 3,725 serious injuries and 101 fatalities. Areas with higher deprivation levels experienced a disproportionate share of these collisions, particularly affecting pedestrians.
Is knife crime a moral panic?
Not necessarily, as the rates of occurrence remain concerning, however, the presentation of London stabbing cases often turns into pandering, ignorance, and moral panic in the worst sense possible.
The reality is that a London stabbing will have a disadvantaged young male of colour as a victim, and the same category will most probably perpetrate it. Women are also at considerably skewed risk at the hands of present or past partners and even family members.
The most common crimes in UK 2022/23
| Crime Category | Number of Incidents |
|---|---|
| Fraud | 3,526,000 |
| Theft | 2,650,000 |
| Violent Crime | 998,000 |
| Computer Misuse | 745,000 |
| Vehicle Offences | 405,872 |
Sources
- CSEW – Crime Survey for England and Wales
- TCSEW – Telephone-operated Crime Survey for England and Wales
- PRC – Police recorded crime
How Can Knife Crime Be Stopped?
The environment and gang culture that generated the London stabbing epidemic greatly resemble the Glaswegian context, pre-SVRU.
Thus, one natural approach to the issue would follow the example of Scotland’s (and the Western world’s) ex-murder capital.
The knife crime-reduction mantra is that violent armed assaults are only reliably correlated to an unfit childhood environment, poor mental health, and socio-economic risk factors. No other aspect can describe the likely assaulters or victims, nor can it point to a better approach.
CasinoAlpha’s Methodology
We have a history of investigating the odds and likelihoods of possibly severe and unfortunate events, such as the chances of war in the Middle East.
We do so fully acknowledging the gravity of the subjects approached. We intend to inform and provide further data for independent verification. We ask our readers to consult the references provided for our study for a better-informed opinion.
Our Process
To proceed with the required tact, we will consult scientifically reliable resources and studies to perform a comparative review.
Once we obtain credible data backed by multiple sources, we synthesise it into digestible content for the British reader. Nonetheless, we aim to maintain the utmost stricture in our presentation by not leaving any doubts or space for interpretation.
Our sources and interpretation
For the presented London stabbing rates, we used the data provided by official governmental organisations.
Additionally, we consulted expert studies on the issue of violent criminality. The conclusions presented in the piece are only those confirmed by specialists.
While we understand statistics and risk assessment, we cannot afford to propagate incorrect interpretations around such a critical subject.
Against toxic discourse
Another essential part of redacting a reliable and correct analysis of the London stabbing epidemic is the choice of published sources.
We have frequently stressed the British media’s inadequacy in approaching the issue. Uncritically parroting uninformed media pieces would go beyond complacency into territories of malfeasance and participation in an already toxic culture.
An ongoing process and its limits
Whether we refer to corrections or changes due to further developments, our readers can expect to see changes to the data and interpretations presented in our study.
We take for granted only scientifically verifiable conclusions from attested sources. Our presentation can only be expected to be as reliable as the expert data we cite.
References
- https://www.standard.co.uk/news/london/knife-crime-london-surges-one-year-stabbing-khan-b1095672.html
- https://benkinsella.org.uk/knife-crime-statistics/
- https://www.standard.co.uk/news/crime/knife-crime-london-rise-latest-statistics-robbery-sadiq-khan-b1114654.html
- https://commonslibrary.parliament.uk/research-briefings/sn04304/
- https://www.statista.com/statistics/864736/knife-crime-in-london/
- https://www.mylondon.news/news/uk-world-news/full-list-london-boroughs-highest-28343668
- https://www.metrosecurity.co.uk/5-common-crimes-uk-2023/
- https://trustforlondon.org.uk/data/road-traffic-collisions/
- https://www.met.police.uk/sd/stats-and-data/met/year-end-crime-statistics-22-23/
- https://www.numbeo.com/crime/compare_cities.jsp?country1=United+Kingdom&city1=London&country2=United+Kingdom&city2=Glasgow
- https://crimerate.co.uk/crime-map
- https://www.safe.co.uk/safezone/2024/01/which-uk-city-has-the-highest-crime-rate-a-business-insight/#:~:text=Leeds%20has%20the%20highest%20number,94%25%20of%20cases%20going%20unsolved
- https://www.mylondon.news/news/uk-world-news/full-list-london-boroughs-highest-28343668
- https://www.ethnicity-facts-figures.service.gov.uk/crime-justice-and-the-law/policing/stop-and-search/latest/
- https://www.ethnicity-facts-figures.service.gov.uk/crime-justice-and-the-law/policing/number-of-arrests/latest/