

New Car Theft Odds Data for 2024: Which Models Are Most at Risk in the UK?

All the information in this page was checked by:

We aim to give players all the information they need based on facts. Before we publish anything, we double and triple-check what we're recommending. We want players to feel certain that our comparisons and rankings tell the full truth.
If you’re thinking about buying a new car in the UK, it’s important to know which models are more likely to be stolen. According to the latest car theft odds data, the risk of having your vehicle stolen in the UK is approximately 1 in 347. Some models, such as the Ford Focus, Ford Fiesta, and Land Rover Range Rover, have significantly higher theft rates. Being aware of which cars are most targeted by thieves can help you make a well-informed decision and avoid becoming a victim.
- Infographic of Car Theft in the UK
- Theft Odds for the Top 20 Most Stolen Cars UK 2022/23
- Least Stolen Cars in the UK in 2022/23
- How Frequent are Car Thefts Across the Country?
- How the UK Stolen Cars Rates Changed from Previous Years
- The Cost of Car Theft in the UK
- Car Theft Across the Years
- Odds of Stolen Cars: UK Regions in Comparison
- Comparison of Stolen Cars UK Hotspots
- When and Where did Car Thefts Occur?
- Causes of Motor Vehicle Theft in the UK
- Essentials for Deterring Car Thefts
- Methodology of Car Theft Statistics UK
- References
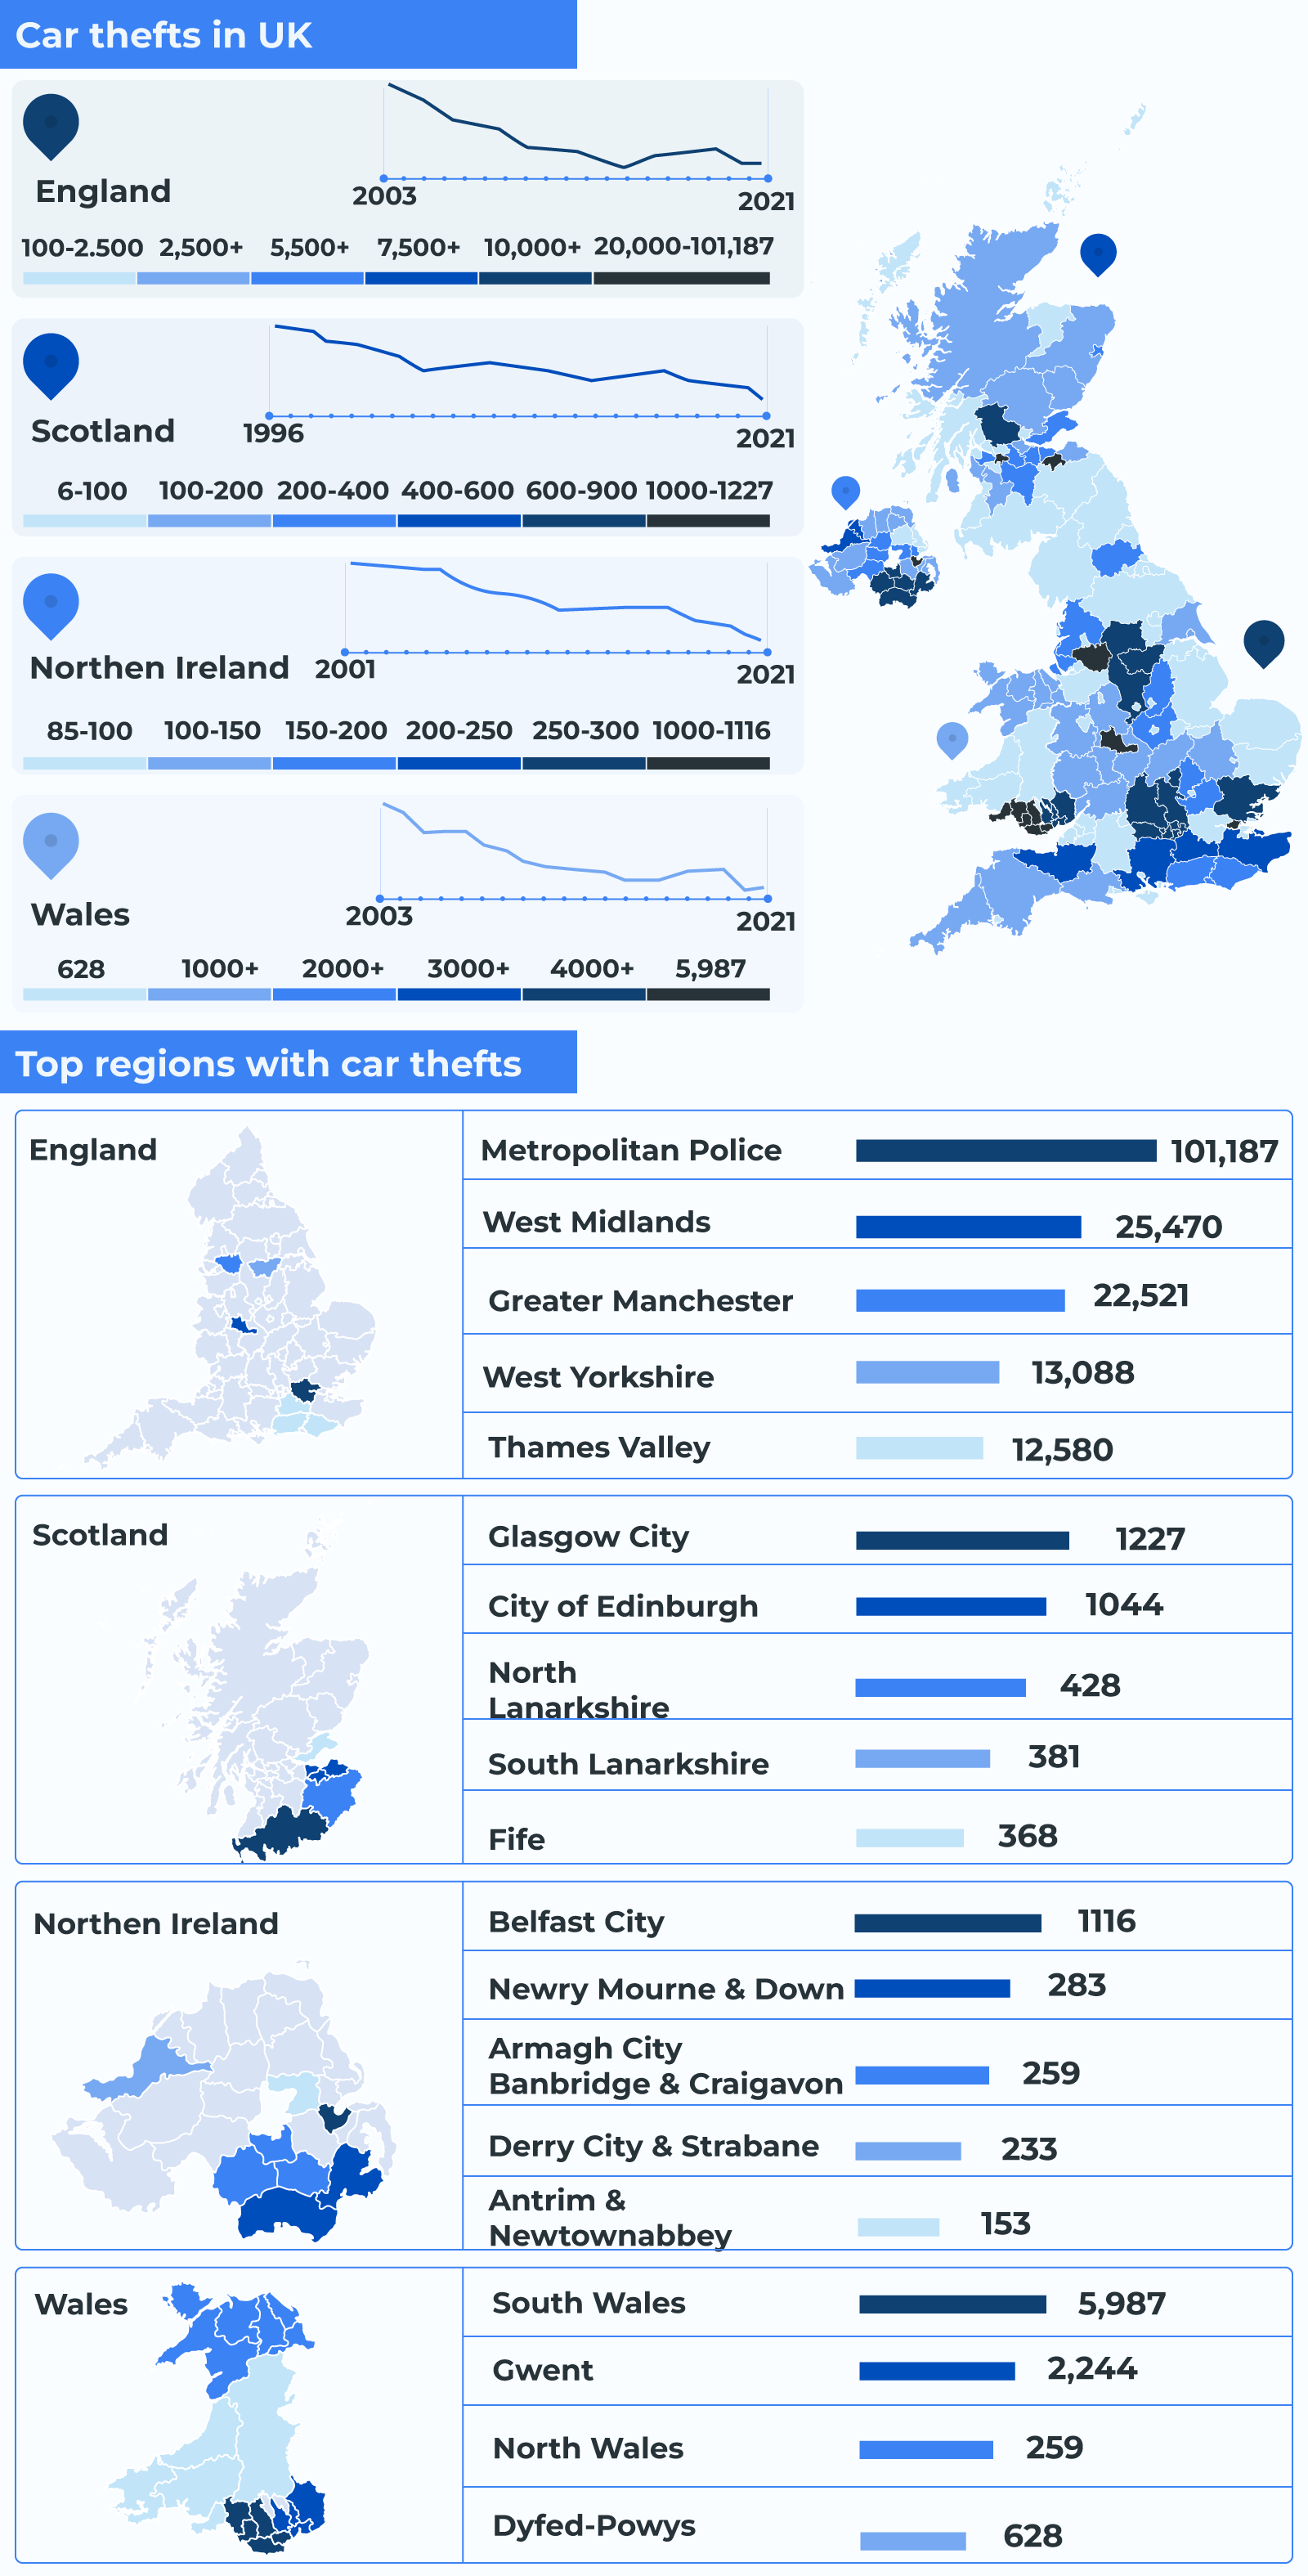
Infographic of Car Theft in the UK
Theft Odds for the Top 20 Most Stolen Cars UK 2022/23
| Car model | Share of stolen cars | Odds of being stolen | Stolen cars | Estimated cost |
|---|---|---|---|---|
| Ford Fiesta | 1 in 29 | 1 in 383.73 | 3,909 | £64,967,580 |
| Land Rover Range Rover | 1 in 30.15 | 1 in 110.00 | 3,754 | £361,134,800 |
| Ford Focus | 1 in 59.20 | 1 in 601.46 | 1,912 | £43,909,080 |
| VW Golf | 1 in 64.50 | 1 in 569.41 | 1,755 | £53,224,762.5 |
| Mercedes-Benz C-Class | 1 in 76.79 | 1 in 256.45 | 1,474 | £68,585,220 |
| BMW 3 Series | 1 in 77.32 | 1 in 436.14 | 1,464 | £55,983,360 |
| Land Rover Discovery | 1 in 89.84 | 1 in 216.39 | 1,260 | £83,985,300 |
| Vauxhall Corsa | 1 in 92.93 | 1 in 894.91 | 1,218 | £26,439,735 |
| Vauxhall Astra | 1 in 103.28 | 1 in 912.89 | 1,096 | £25,509,400 |
| Mercedes-Benz E-Class | 1 in 138.38 | 1 in 302.07 | 818 | £48,104,535 |
The provided data on the most stolen cars, UK costs and odds of occurrence come from the statistics published by the DVLA (Driver and Vehicle Licensing Agency).
The share of total motor vehicle theft cases considers how frequently the models were found among the stolen car database UK figures. The stolen cars UK odds account only for the number of car thefts of the model, weighed against the total number of models in Great Britain.
Disclaimer
When investigating sensitive data related to criminality, such as the rates of car theft or the odds of knife crime in London, we advise you to seek the guidance of authorities. We provide data strictly for informational purposes.
What we do
CasinoAlpha crunches the numbers for the British reader and investigates motor vehicle theft trends, possible causes, and solutions. You can find the current odds for motor car theft odds, the rates of stolen cars UK citizens experienced regional breakdowns, and their change over time.
What is the most stolen car in the UK?

While Ford Fiestas made up the highest share of the stolen cars, when considering the most stolen cars, UK figures point to the Range Rover Land Rover.
In other words, owning a Range Rover currently poses the highest odds of having it stolen. The Land Rover Discovery is the second riskiest vehicle to own, according to the most stolen cars UK statistics in relation to the number of models in the country.
According to UK car theft statistics, the Mercedes-Benz E-Class comes in third, with the Ford Fiesta being fourth.
The discrepancy between car theft odds and the share of the total stolen cars comes from the different numbers of models within the UK.
Past and present causes
The UK’s odds of most stolen cars are high for two reasons. The specific models are frequently encountered, known among car thieves, and have considerable resale value.
In the past, old models with lacklustre security systems were most at risk. However, with the advent of frequency hijacking devices, keyless car theft of newer models has become frequent.
However, some car models still have not appeared in the stolen cars database UK statistics.
What’s the most popular car in the UK?
The Ford Fiesta is most prevalent in Great Britain, which may explain the high number of stolen models.
The Ford Focus follows – another model appearing on the most stolen cars UK 2022/23 list. The same is true for the next three in line, the Vauxhall Astra, VW Golf, and the Vauxhall Corsa.
Least Stolen Cars in the UK in 2022/23
| Model | Production years | Thatcham security rating |
|---|---|---|
| BMW X6 M50d | 2015-2019 | Superior |
| BMW 218i Gran Coupe M Sport | 2020-present | Superior |
| Mini EV | 2019-present | Superior |
| Porsche Taycan Turbo | 2020-present | Superior |
| Škoda Superb | 2015-present | Superior |
| Toyota GR Supra | 2019-present | Superior |
Subject to change
The models reflect ratings from Thatcham Research, a trusted security systems rating agency. Their security considerations may change in the future.
Built-in car theft deterrents and security systems do not correspond to a car’s price. For instance, Thatcham Research rated the considerably more expensive Tesla Model 3 to have a basic level security system.
However, you should take security ratings with a grain of salt. The same trusted source rated the Land Rover Discovery Sport D150 Superior in matters of anti-theft systems. However, the same model topped the top 20 most stolen cars UK list.
Car thieves bypass most built-in security systems once they find flaws or vulnerabilities. Vehicle safety requires effort on the part of the driver.
How Frequent are Car Thefts Across the Country?
A motor vehicle theft occurs every eight minutes in the UK, corresponding to about 180 stolen cars per day and 1260 per week.
Subject to change
We are providing the most recent data from official sources in the UK. All published findings will be updated as soon as new data is available. Some modes of characterisation of car theft and vehicle crime may differ between regions. We advise our readers to peruse the entire report for relevant observations.
Current stolen cars UK odds and statistics
The rate of stolen cars UK in 2022/23 approximates 1 in 347.06, with an additional 1 in 221.77 vehicles being stolen from.
The overall odds of car theft crimes in the UK amount to 1 in 117.6. General motor vehicle theft includes stolen cars, thefts from cars, attempts to break in, and interferences.
Source of data
The presented data combine the figures from official yearly reports from the Office of National Statistics, Scotland Police, and the Police Service of Northern Ireland. These organisations have different definitions and data collection methods for motor vehicle theft. We have selected and compiled the rates to reflect the concrete situation in the UK best.
How the UK Stolen Cars Rates Changed from Previous Years
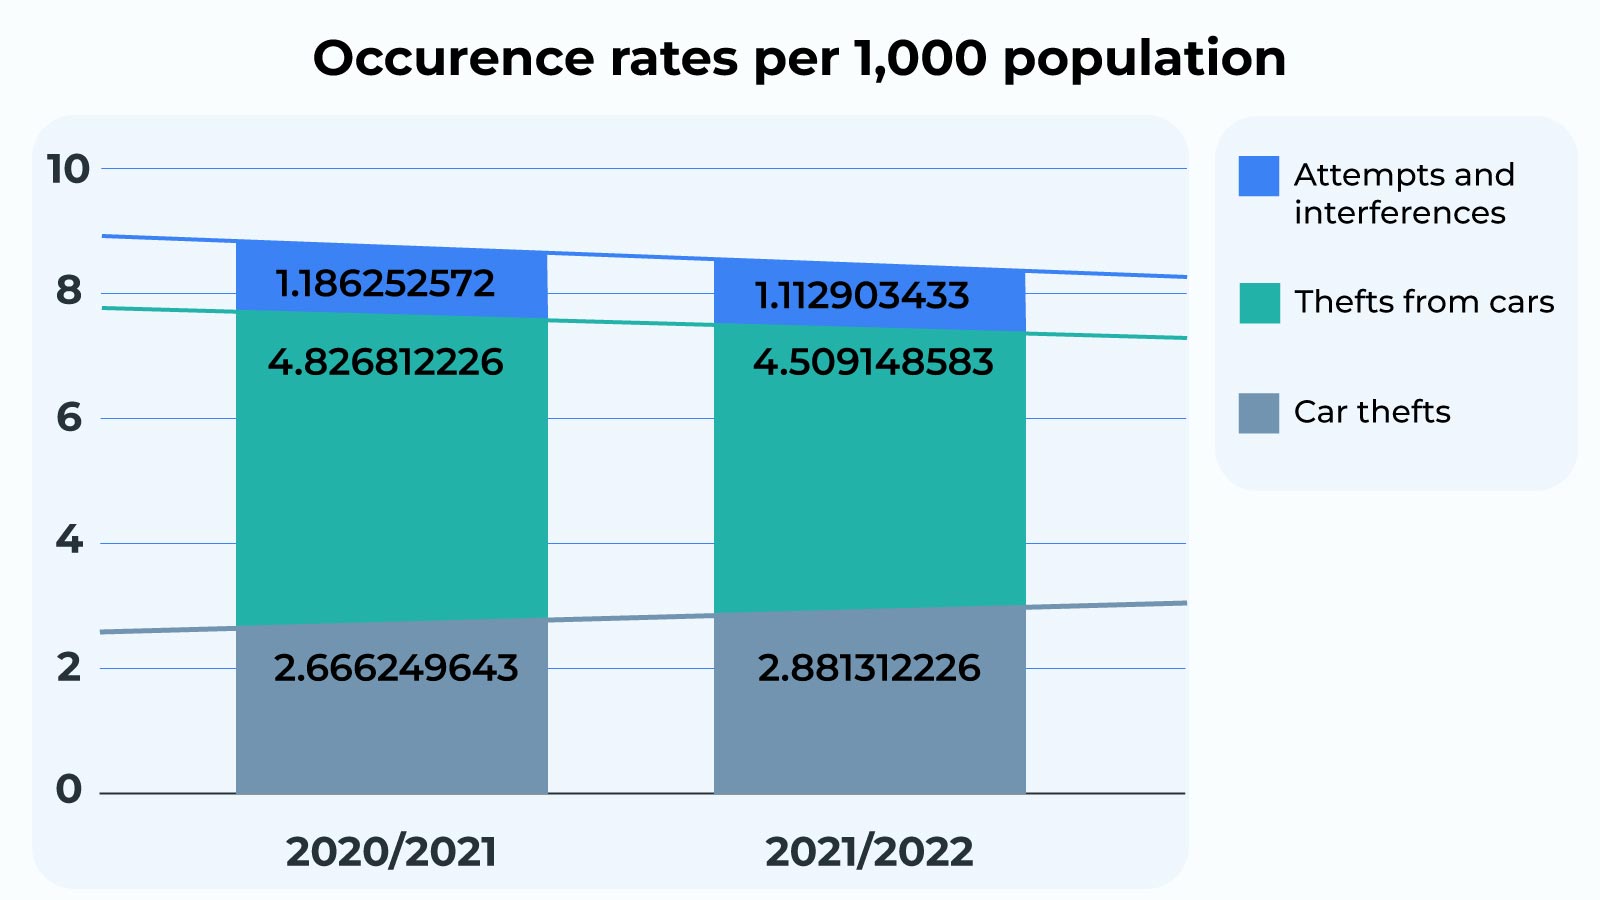
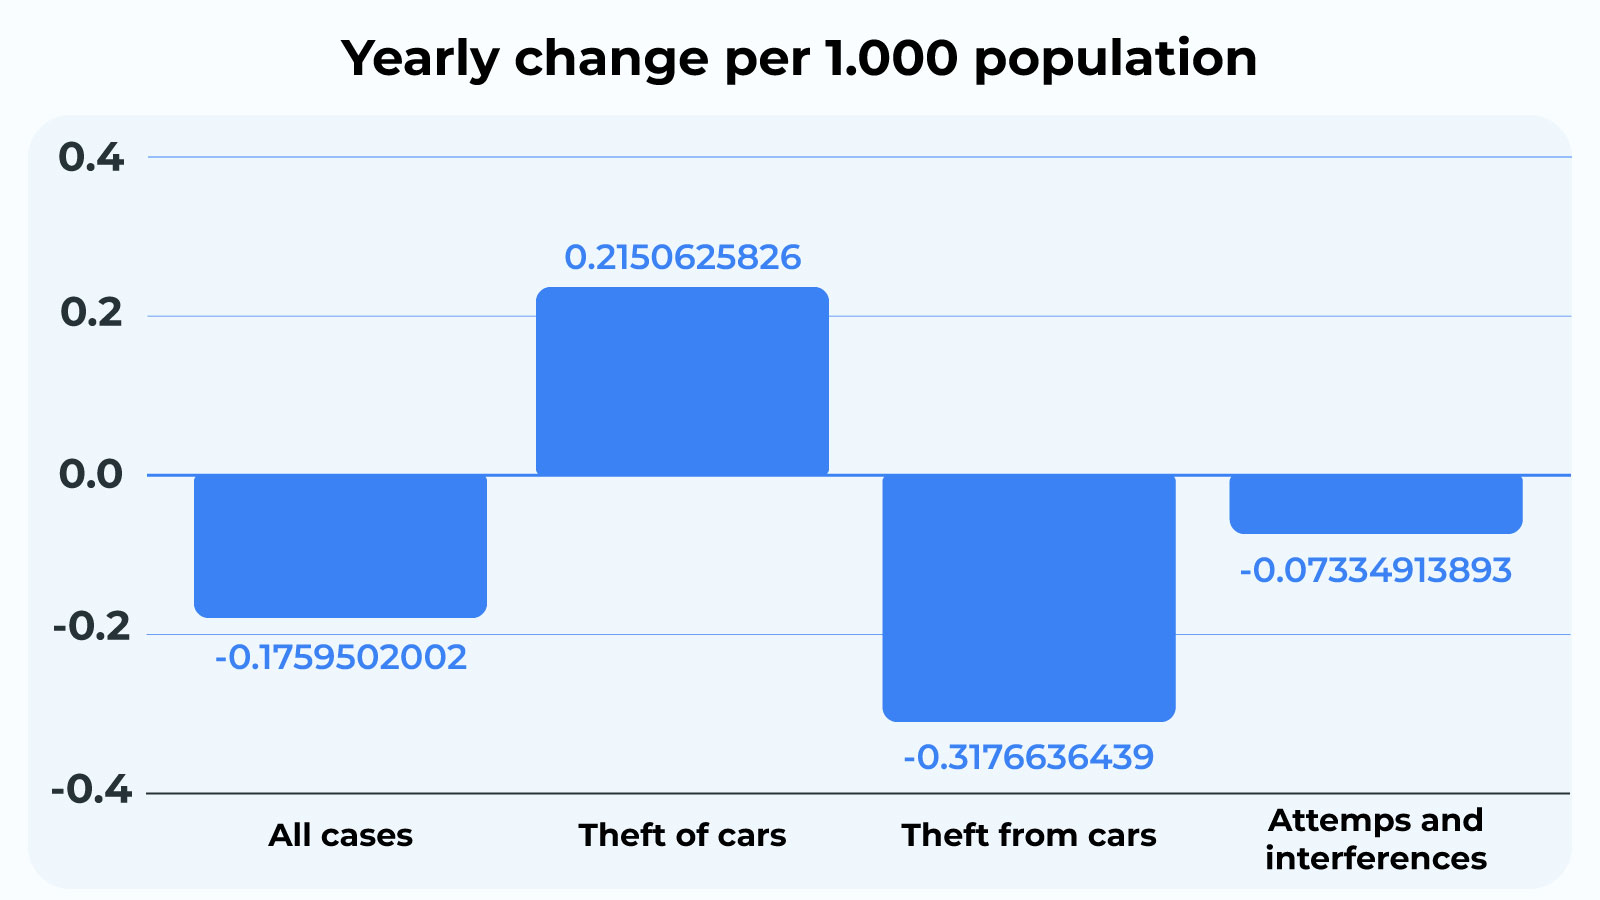
The total number of motor vehicle thefts and crimes has decreased, both per total and in most areas, such as the attempts, interferences, and thefts from cars.
The only outlier remains the rate of stolen cars, with UK regions seeing a new increase in cases.
Stolen cars and crimes change from the previous years
| Crime type | 2021/22 rates | 2022/23 rates | Change |
|---|---|---|---|
| All cases | 8.679314441 | 8.503364241 | -0.1759502002 |
| Car thefts | 2.666249643 | 2.881312226 | +0.2150625826 |
| Thefts from cars | 4.826812226 | 4.509148583 | -0.3176636439 |
| Attempts and interferences | 1.186252572 | 1.112903433 | -0.07334913893 |
Stolen cars UK change in rates visualised
The Cost of Car Theft in the UK
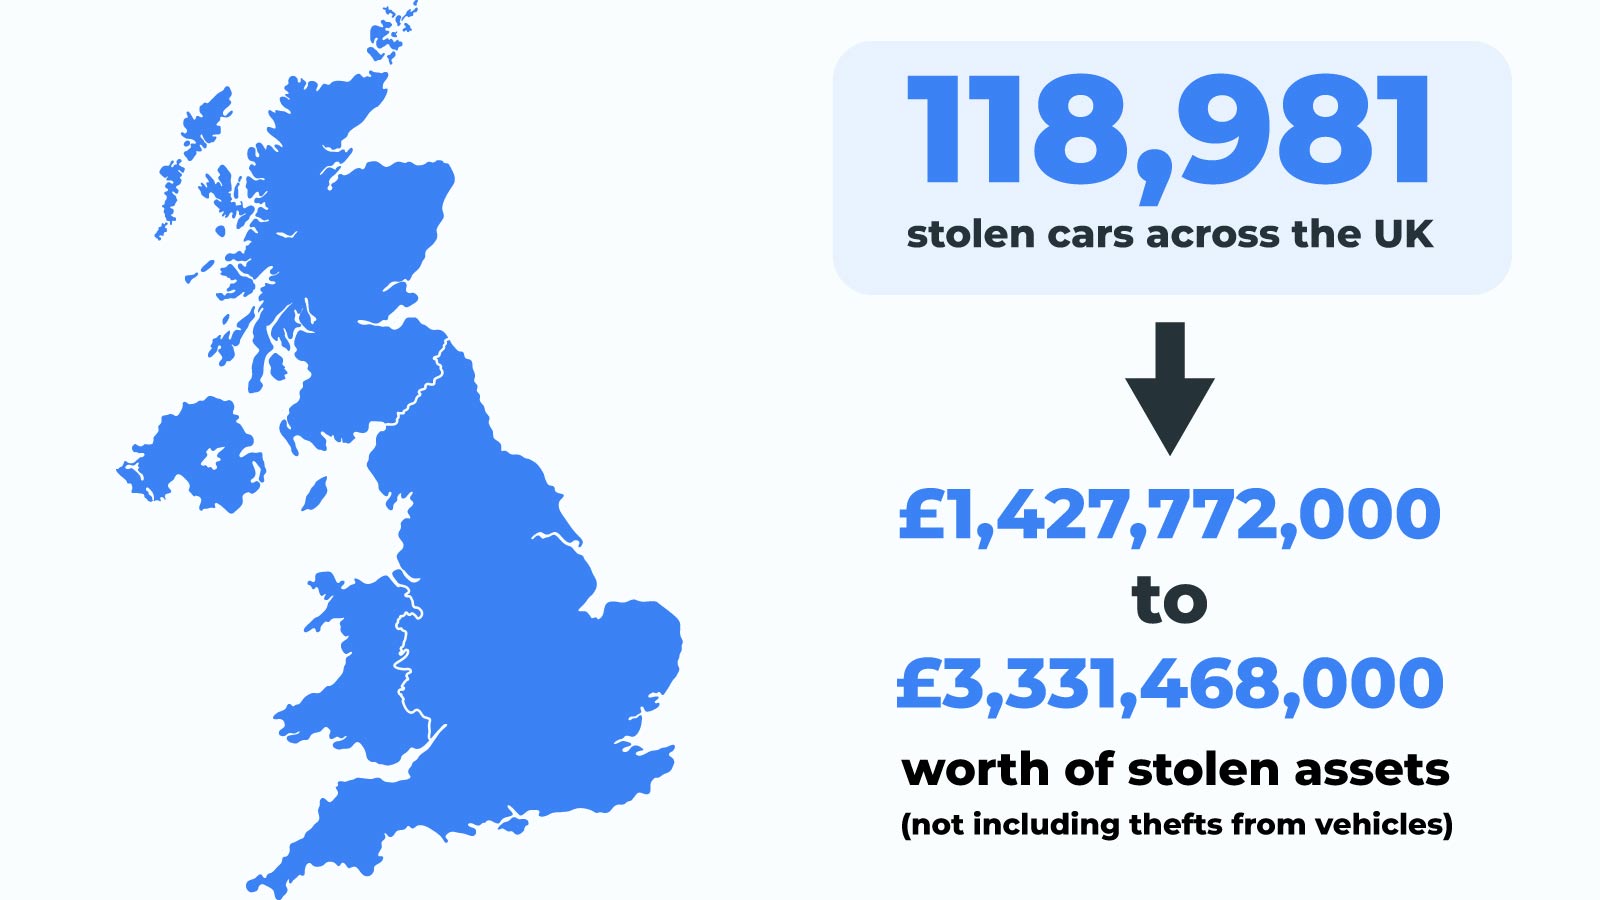
With 118,981 stolen cars across the UK, car thieves managed to take £1,427,772,000 to £3,331,468,000 worth of stolen assets, not including thefts from vehicles.
Expert sources cite the average price of buying a car in the UK to be between £12,000 and £28,000, depending on the size and model.
Disclaimer
We present the cost of stolen UK car numbers without considering the case’s outcome. For around 28% of stolen cars, UK authorities managed to return the vehicle to their rightful owner.
Cost of all car thefts alone, per region
| Region | Number of car thefts | Lowest average loss | Highest average loss |
|---|---|---|---|
| England and Wales | 113,194 | £1,358,328,000 | £3,169,432,000 |
| Scotland | 4,512 | £54,144,000 | £126,336,000 |
| Northern Ireland | 1,275 | £15,300,000 | £35,700,000 |
We have presented the gross estimate of the cost of UK car theft between 2021 and 2022. However, the net value is not far from our figures.
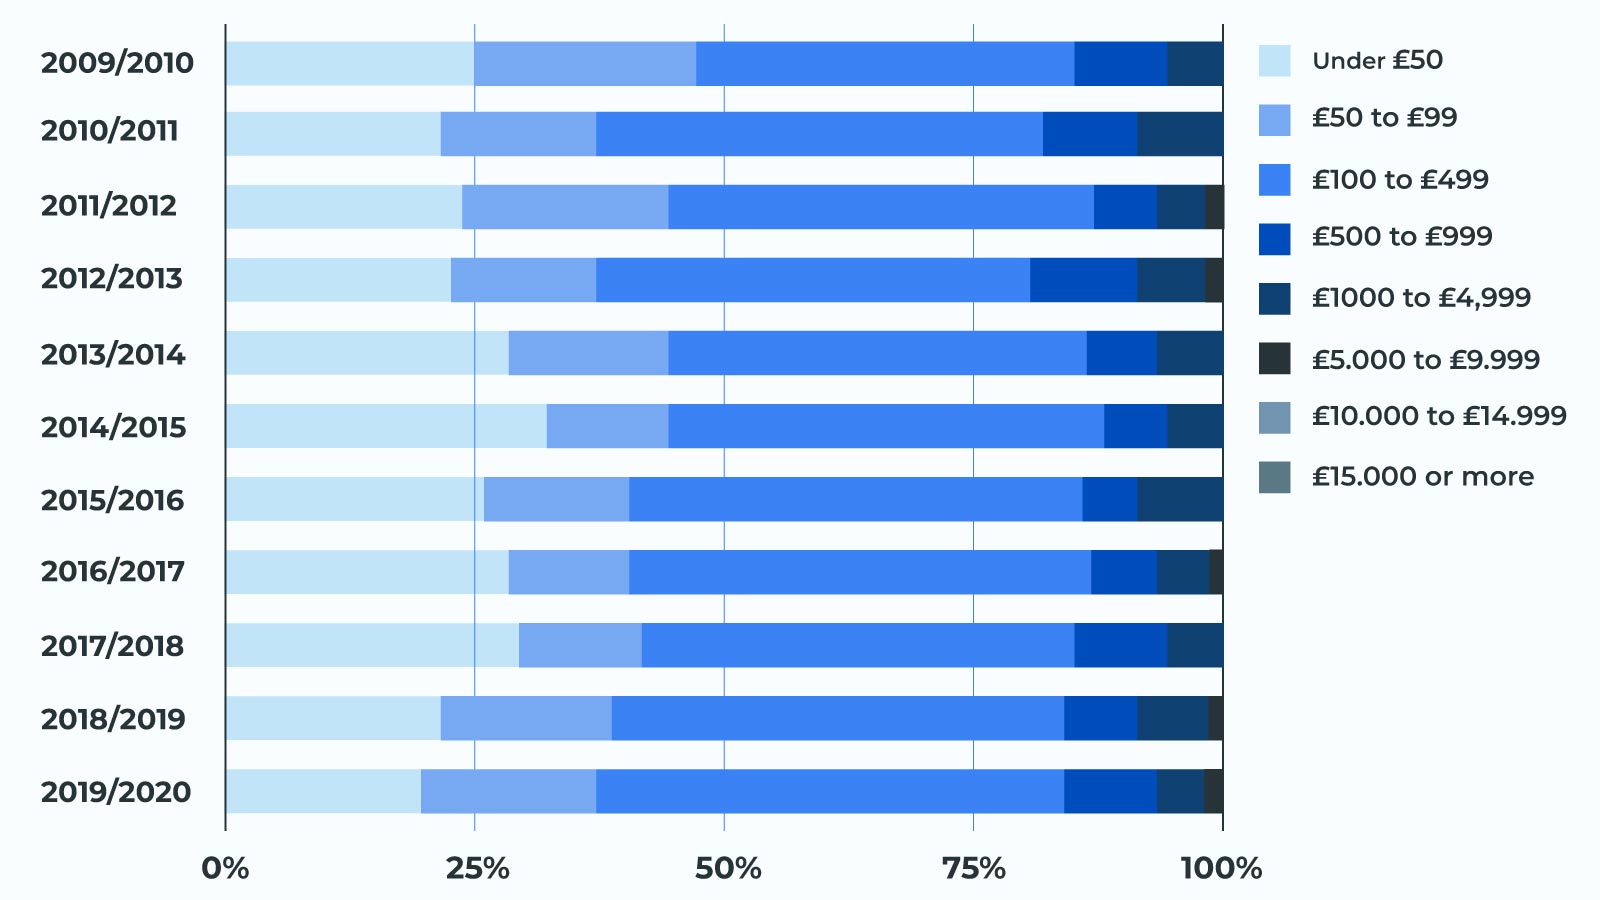
Cost of stolen cars across time
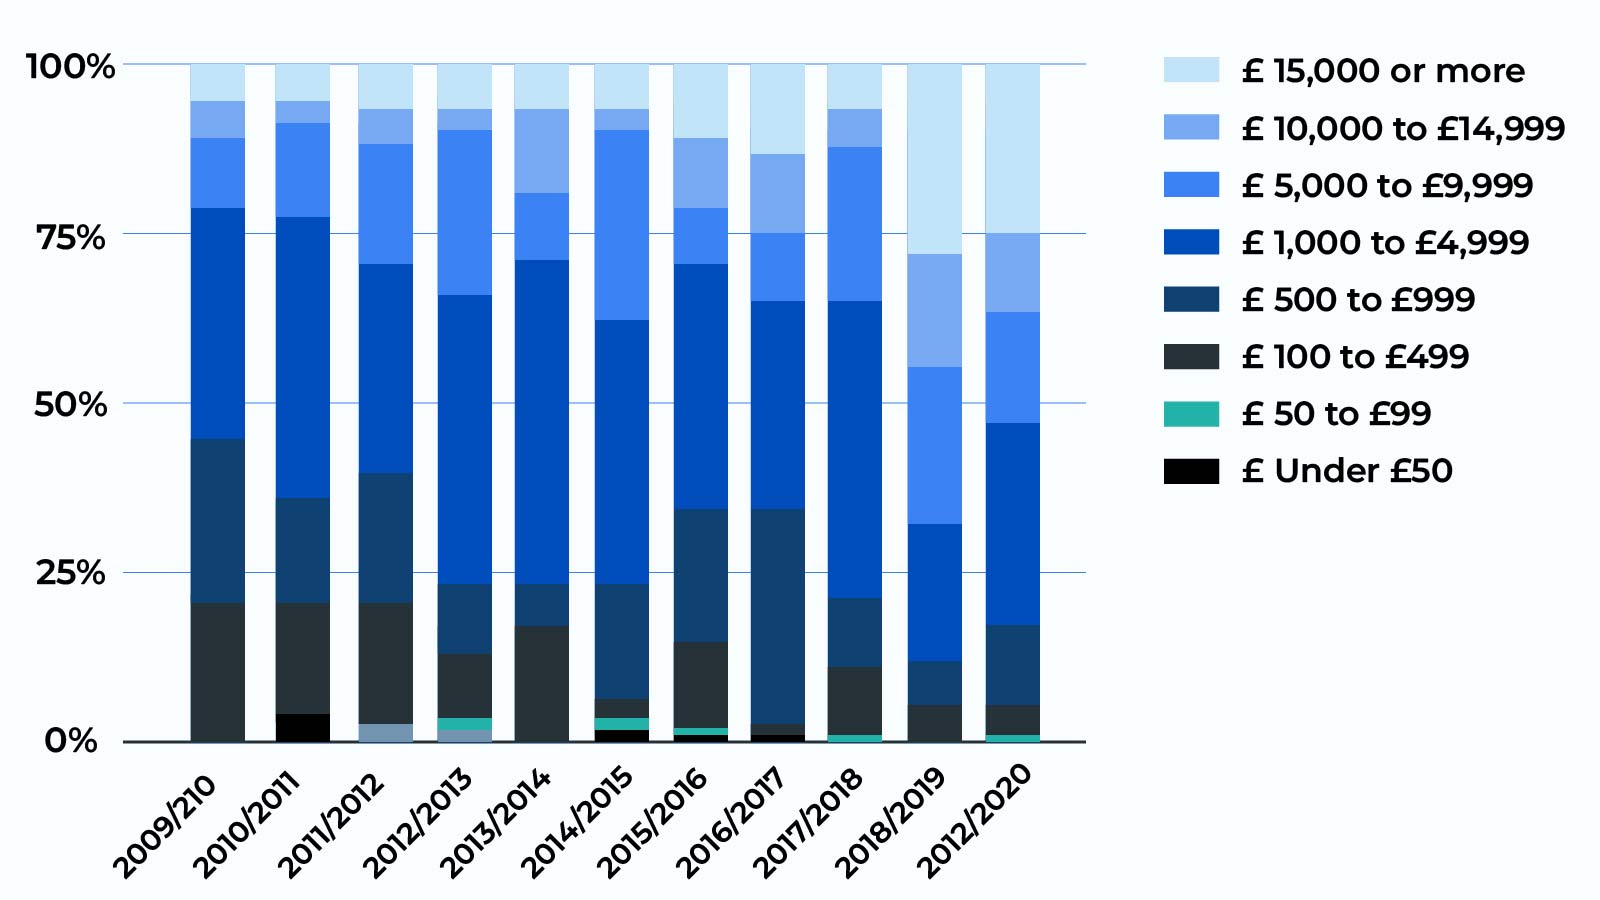
A historical perspective on the issue indicates that the price of most stolen cars in the UK tended to increase, with over 50% of vehicles being valued at over £5,000 in 2020.
Mean and median costs across time
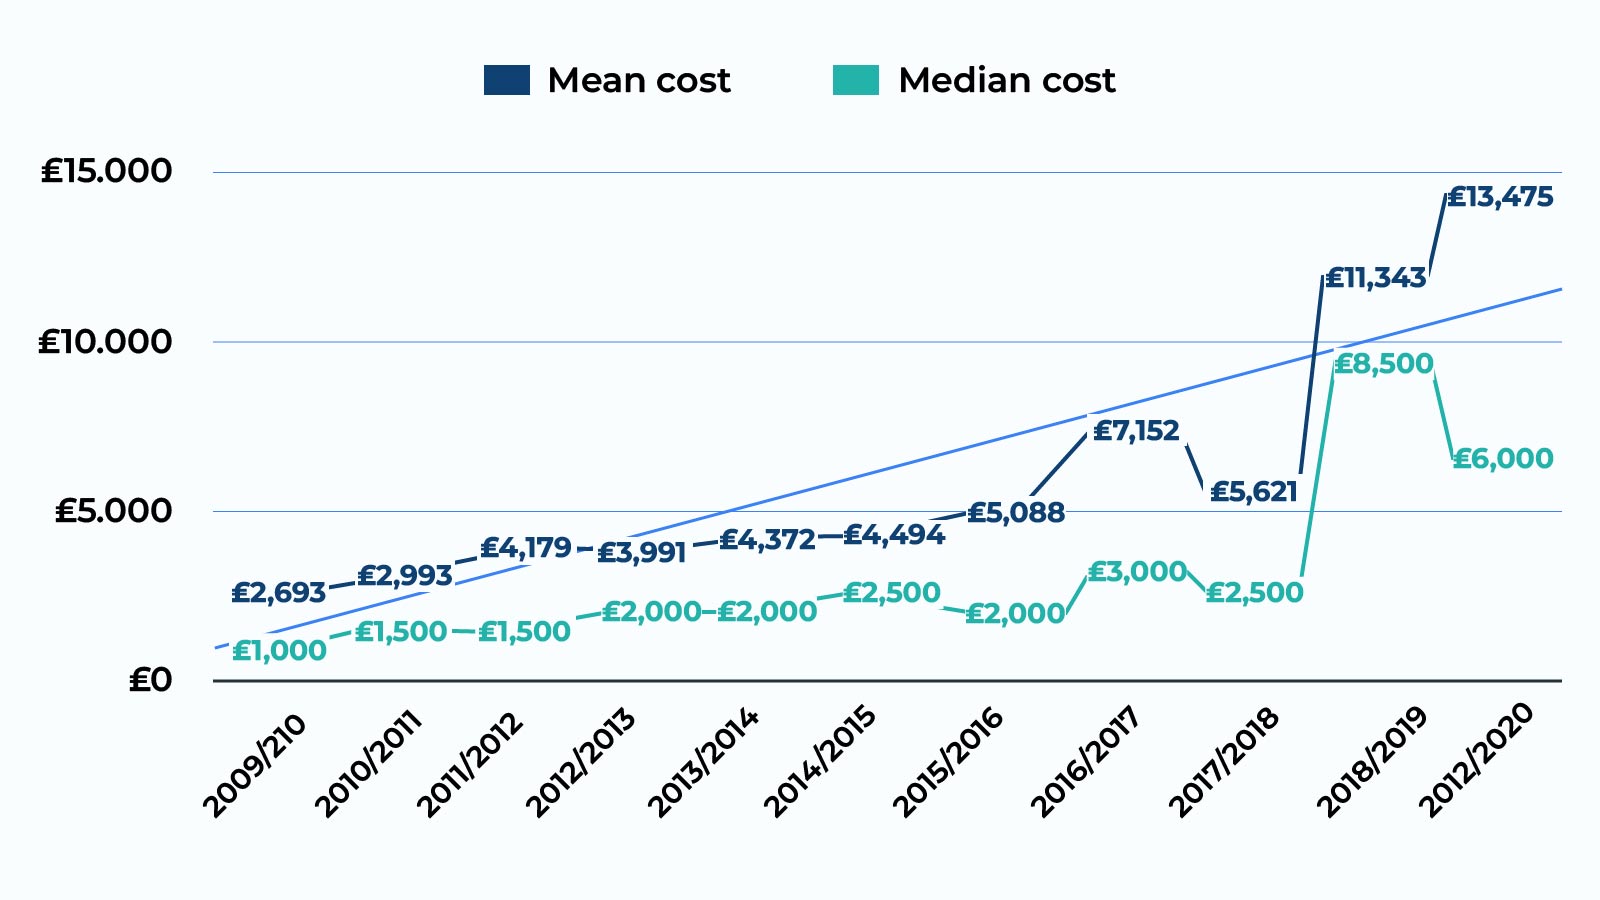
Both mean and median costs of one car theft across the UK have increased and are expected to keep doing so.
The recovery rate of stolen cars plummeted
There is one apparent reason insurers reported losing around £1.5 billion due to stolen cars: UK authorities only recovered 28% of all stolen vehicles.
Concerning the chances of finding a stolen car, UK authorities’ rate had diminished almost exponentially since 2006, when the rate of recovery was as high as 80%.
Recovered stolen cars are less likely to be damaged today than a decade ago
Keyless car theft has changed the profile of such cases. This fact is visible in the odds that victims recover their cars undamaged.
Nowadays, there is a nearly 50% chance that if you manage to recover your car, it will be returned unscathed or with minimum damage.
Compare this rate with the 15% likelihood of getting your vehicle recovered undamaged a decade ago.
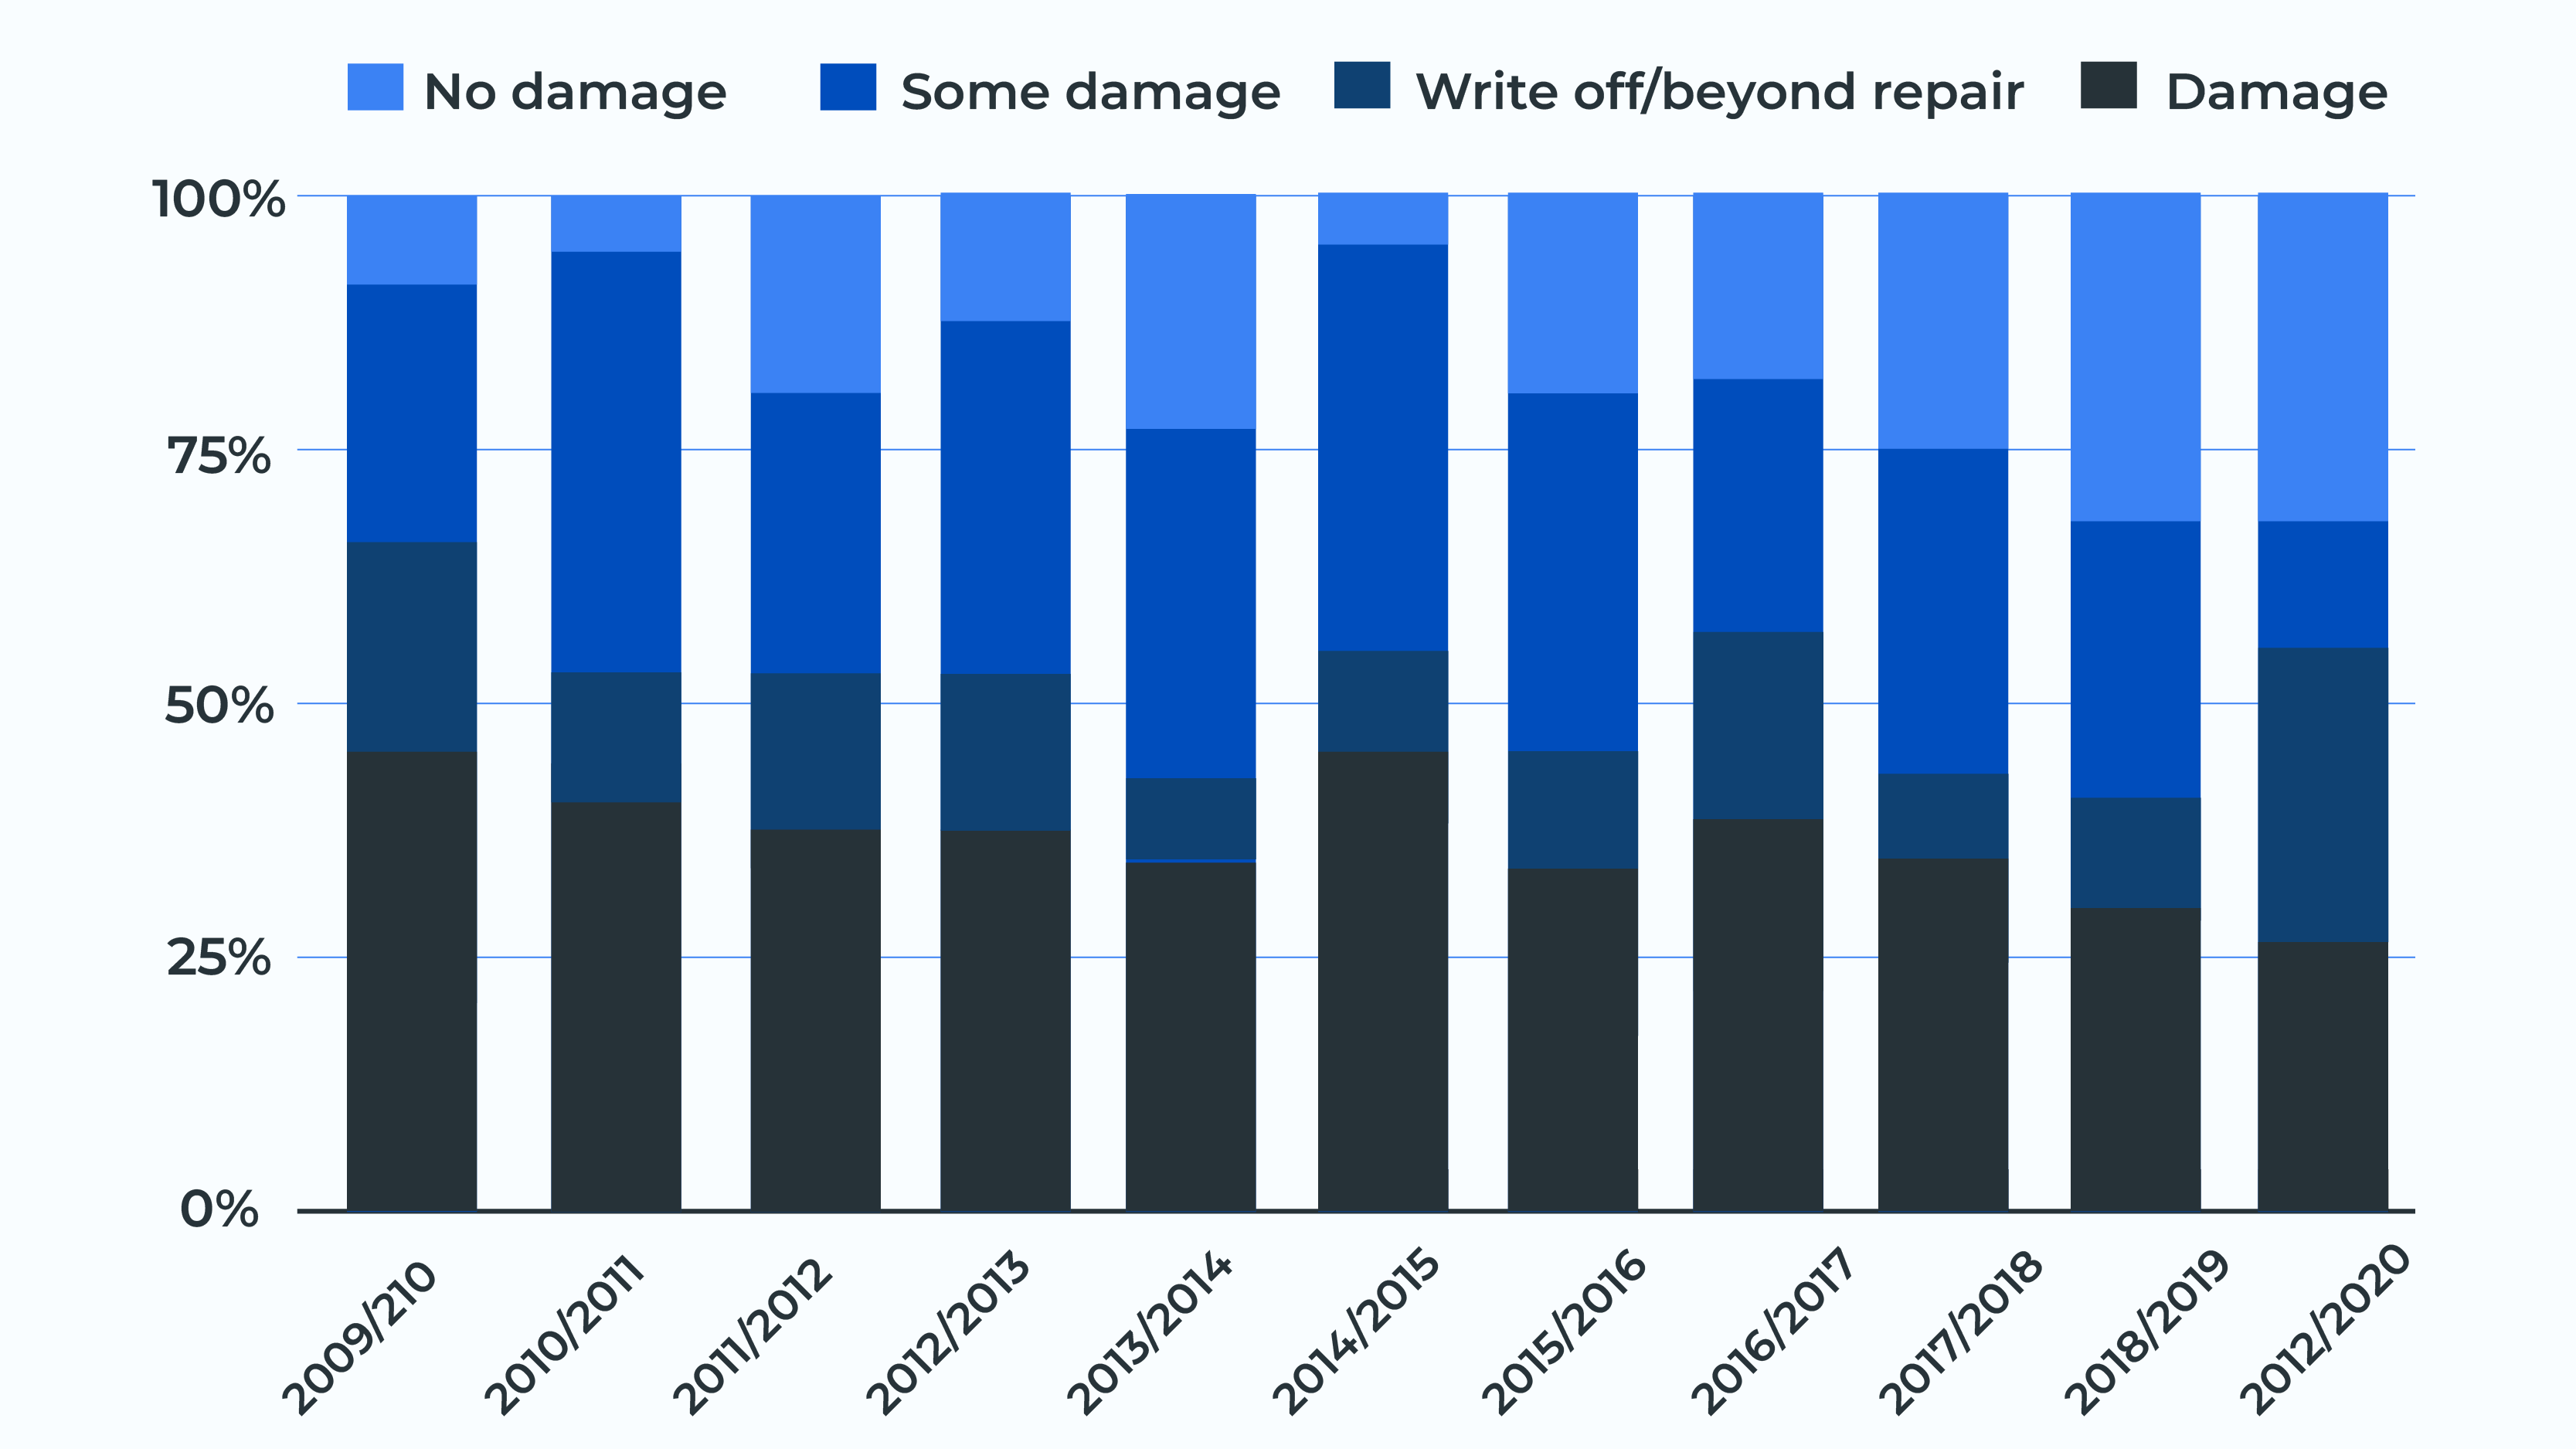
Price of damage for returned cars across the years
One factor for the high cost of car theft
It is true that for stolen cars, UK authorities did record higher rates, but only marginally so. The higher cost of motor vehicle theft also results from an increased price of vehicles.
Thus, although car thefts decreased since the 2000s, the piecewise price of a vehicle increased. Vehicle thefts are rarer but considerably more damaging economically.
Car Theft Across the Years
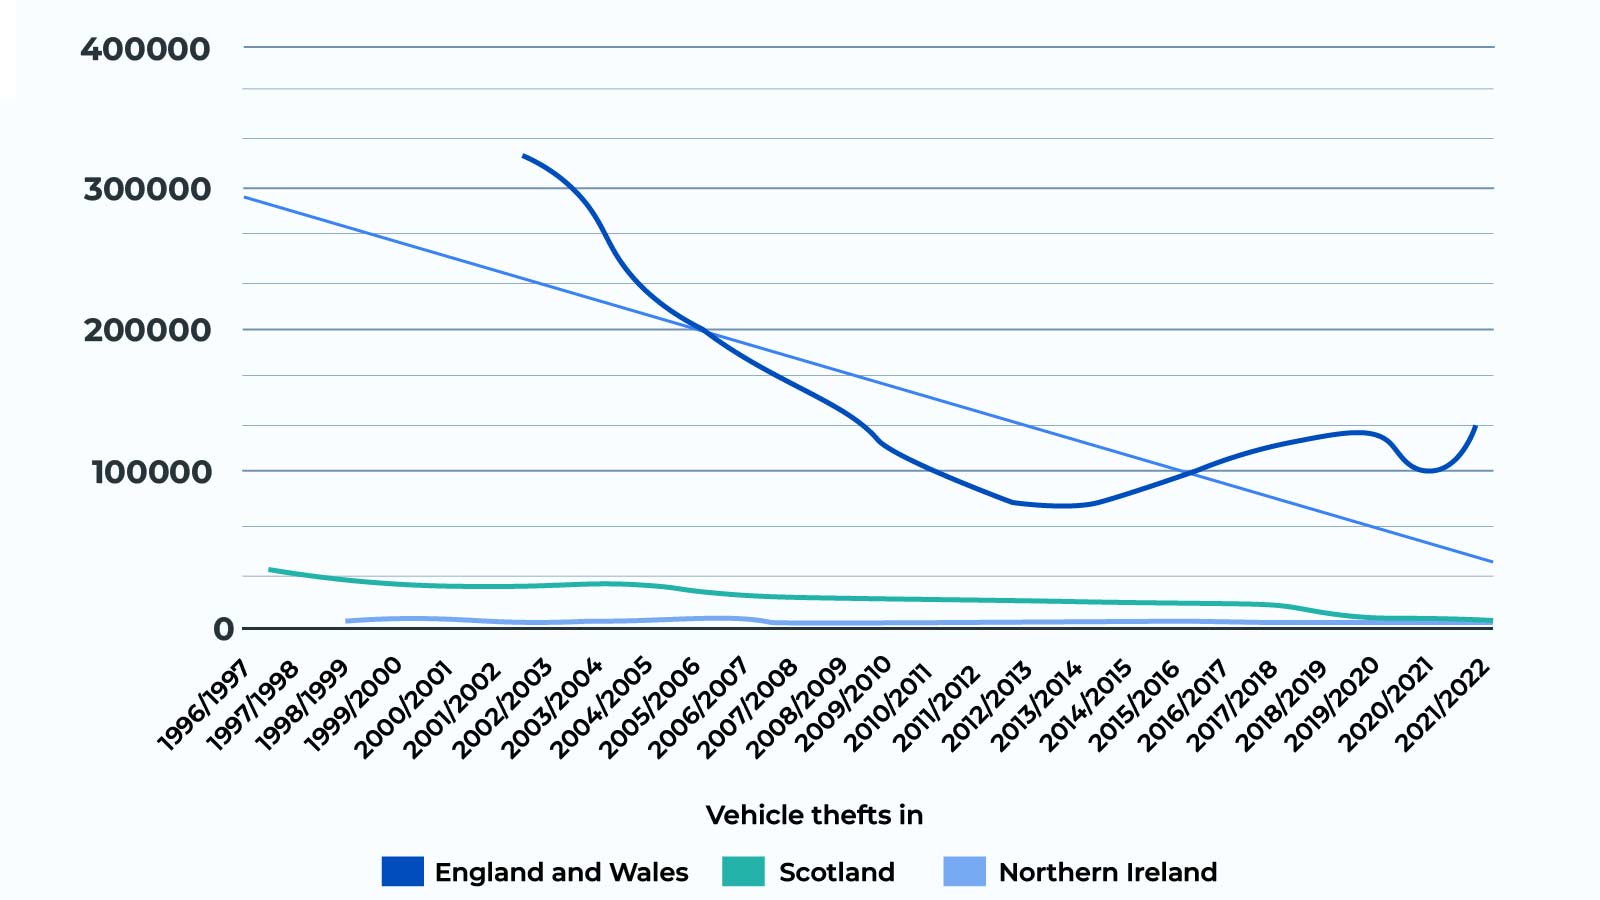
Stolen cars UK trends beginning in 1996 show a slight but sure decrease in the number of car thefts.
The last notable spike in car theft cases started around 2016/17 when their number jumped the 100,000 threshold across the UK. Car thefts only became more frequent, reaching their zenith in 2019/20, with 126,092 motor vehicle theft reports.
The 2022/23 car theft statistics were only the highest since 2020. More so, they do not even compare to the motor vehicle theft rates seen before 2010.
What do these numbers mean for 2024?
We still are ahead of the curve, but this year’s stolen cars UK trends may signal another multi-year spike in car thefts.
You can compare this year’s UK car theft statistics with the ones seen during 2017/18, i.e., right before the rates jumped above 125,000 cases per year.
Disclaimer
We can only go by educated guesses based on current trends. However, like in the case of our report on the existing support for the monarchy, we proceed to explore possible outcomes with the utmost caution and sobriety.
How many cars are stolen each year?
- England and Wales average 143,016.65 car thefts per year, with an additional 354,871.9 thefts from cars
- Scotland experiences an average of 13,473.12 motor vehicle theft cases per year and 19,356.88 thefts from vehicles by OLP
- The average stolen vehicle rate in Northern Ireland is 4,089.79 per year, with 3,809.15 thefts from cars
The most stolen cars in 2024
| Model | Share of total car thefts | Car theft odds of the model |
|---|---|---|
| Ford Fiesta Zetec | 1 in 237.27 | 1 in 105.26 |
| Ford Fiesta Titanium Turbo | 1 in 282.56 | 1 in 199.43 |
| Range Rover Sport HSE SDV6 | 1 in 314.85 | 1 in 85.71 |
| Ford Fiesta Titanium X | 1 in 318.90 | 1 in 57.88 |
| Ford Fiesta ST-2 Turbo | 1 in 330.60 | 1 in 56.67 |
| Ford Fiesta ST-3 Turbo | 1 in 364.63 | 1 in 62.50 |
| Ford Fiesta Titanium | 1 in 411.53 | 1 in 224.07 |
| Ford Fiesta Zetec Turbo | 1 in 486.17 | 1 in 431.37 |
| Range Rover Sport HSE Dynamic SDV6 | 1 in 569.99 | 1 in 155.17 |
| BMW 520D M Sport | 1 in 757.09 | 1 in 41.22 |
Easiest car to steal 2024
BMW 520D M Sport owners were most at risk of falling victim to car thieves, with a 1 in 41.22 chance of losing their car.
Odds for the most stolen cars, UK 2022
| Models | Share of total car thefts | Motor vehicle theft odds |
|---|---|---|
| Ford Fiesta | 1 in 36.97 | 1 in 471.70 |
| Land Rover Range Rover | 1 in 43.52 | 1 in 40.96 |
| VW Golf | 1 in 63.49 | 1 in 506.33 |
| Ford Focus | 1 in 79.01 | 1 in 756.14 |
| BMW 3 Series | 1 in 87.38 | 1 in 397.21 |
| Vauxhall Astra | 1 in 111.36 | 1 in 763.77 |
| Land Rover Discovery | 1 in 139.32 | 1 in 311.11 |
| Mercedes-Benz E Class | 1 in 163.69 | 1 in 332.90 |
| BMW 5 Series | 1 in 184.94 | 1 in 353.98 |
| Nissan Qashqai | 1 in 191.43 | 1 in 847.33 |
| Ford Kuga | 1 in 202.24 | 1 in 438.71 |
| BMW X5 | 1 in 227.56 | 1 in 181.49 |
| Fiat 500 | 1 in 350.24 | 1 in 1013.97 |
| Mercedes-Benz GLC | 1 in 366.63 | 1 in 207.60 |
| Audi A6 | 1 in 467.86 | 1 in 544.78 |
Easiest car to steal 2022
For the worst of most stolen cars, UK odds point towards the Range Rover, which came in second for the total share of car thefts and first in chances of being stolen.
Most stolen cars 2021
- Range Rover Sport
- BMW X5
- Mercedes-Benz C-Class
- Range Rover Vogue
- Land Rover Discovery
- BMW X6
- Range Rover Evoque
- BMW 3 Series
- Range Rover Autobiography
- Mercedes E Class
Most stolen cars UK 2020
- BMW X5
- Mercedes-Benz C Class
- BMW 3 Series
- Mercedes-Benz E Class
- BMW 5 Series
- Range Rover Vogue
- Land Rover Discovery
- Range Rover Sport
- Mercedes-Benz S Class
- Mercedes-Benz GLE
Most stolen cars 2019
- Mercedes-Benz C Class
- BMW X5
- Range Rover Sport
- Mercedes-Benz E Class
- BMW 3 Series
- Land Rover Discovery
- Range Rover Autobiography
- BMW M3
- VW Golf
- Audi RS4
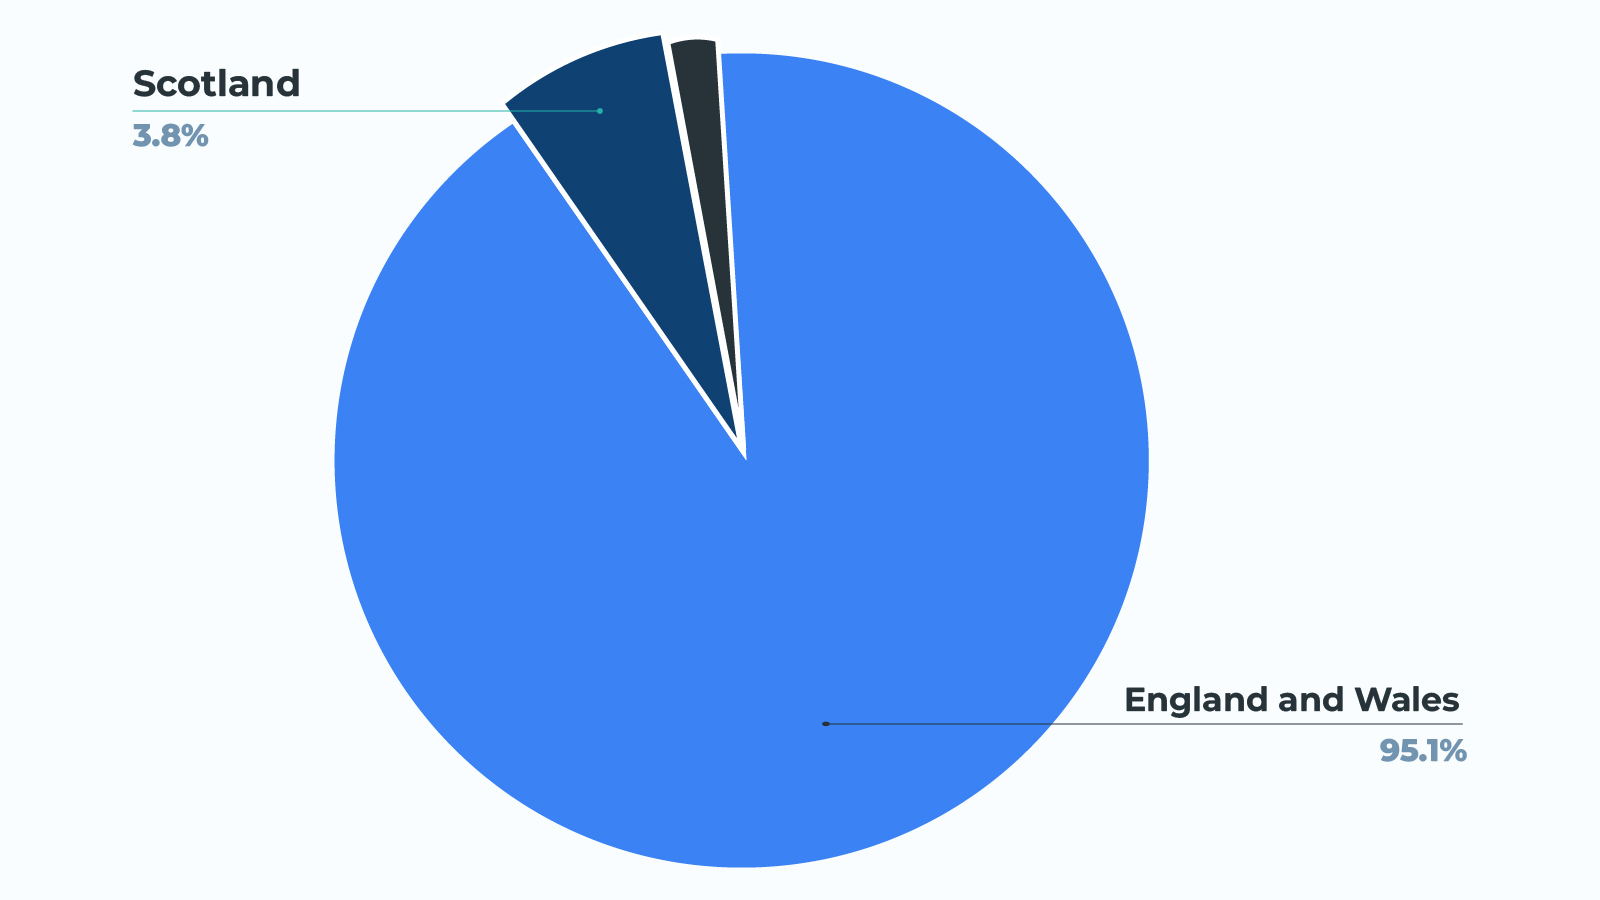
Odds of Stolen Cars: UK Regions in Comparison
England and Wales are the regions that see the most stolen cars in the UK. Scotland comes next, with Northern Ireland contributing the least number of motor vehicle thefts.
Comparison of car theft rates adapted to population
| Region | Rate per 1,000 population | Sub-region with most thefts |
|---|---|---|
| England and Wales | 1.895 | Belfast City |
| Scotland | 0.819 | Glasgow City |
| Northern Ireland | 0.638 | London Metropolitan Area |
Share of stolen cars, UK regions 2024
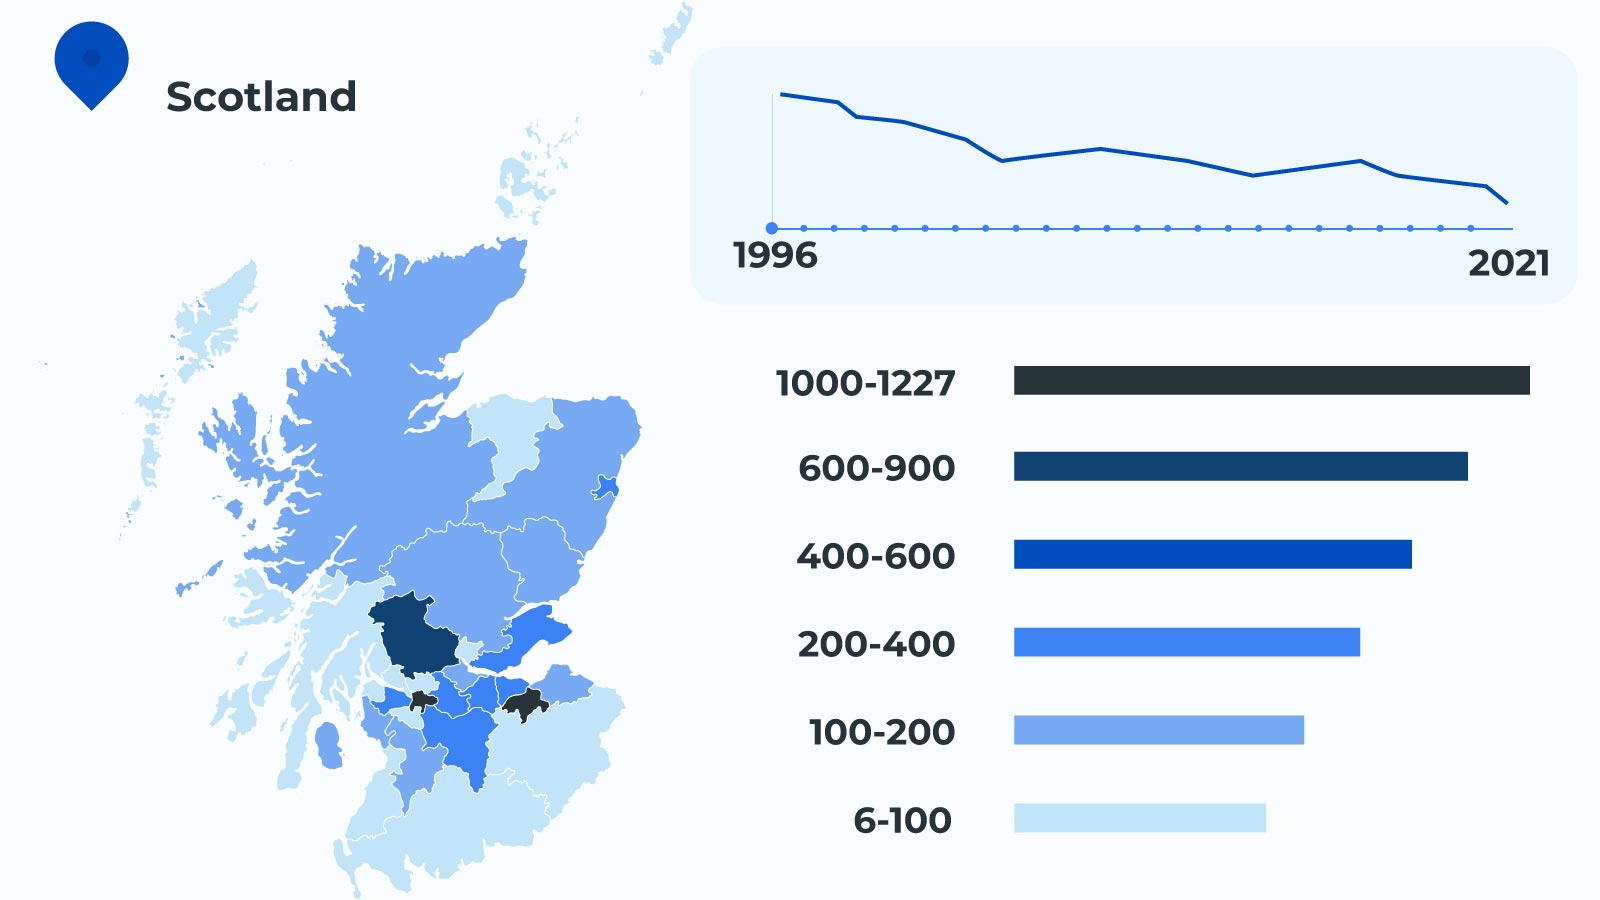
Number of car thefts in Scotland
Scottish police reports
While the numbers presented for the Scottish rate of motor vehicle thefts reflect current police reports, there may be differences due to the categorisation of some thefts from cars as OLP thefts.
Car thefts in Scotland across the years
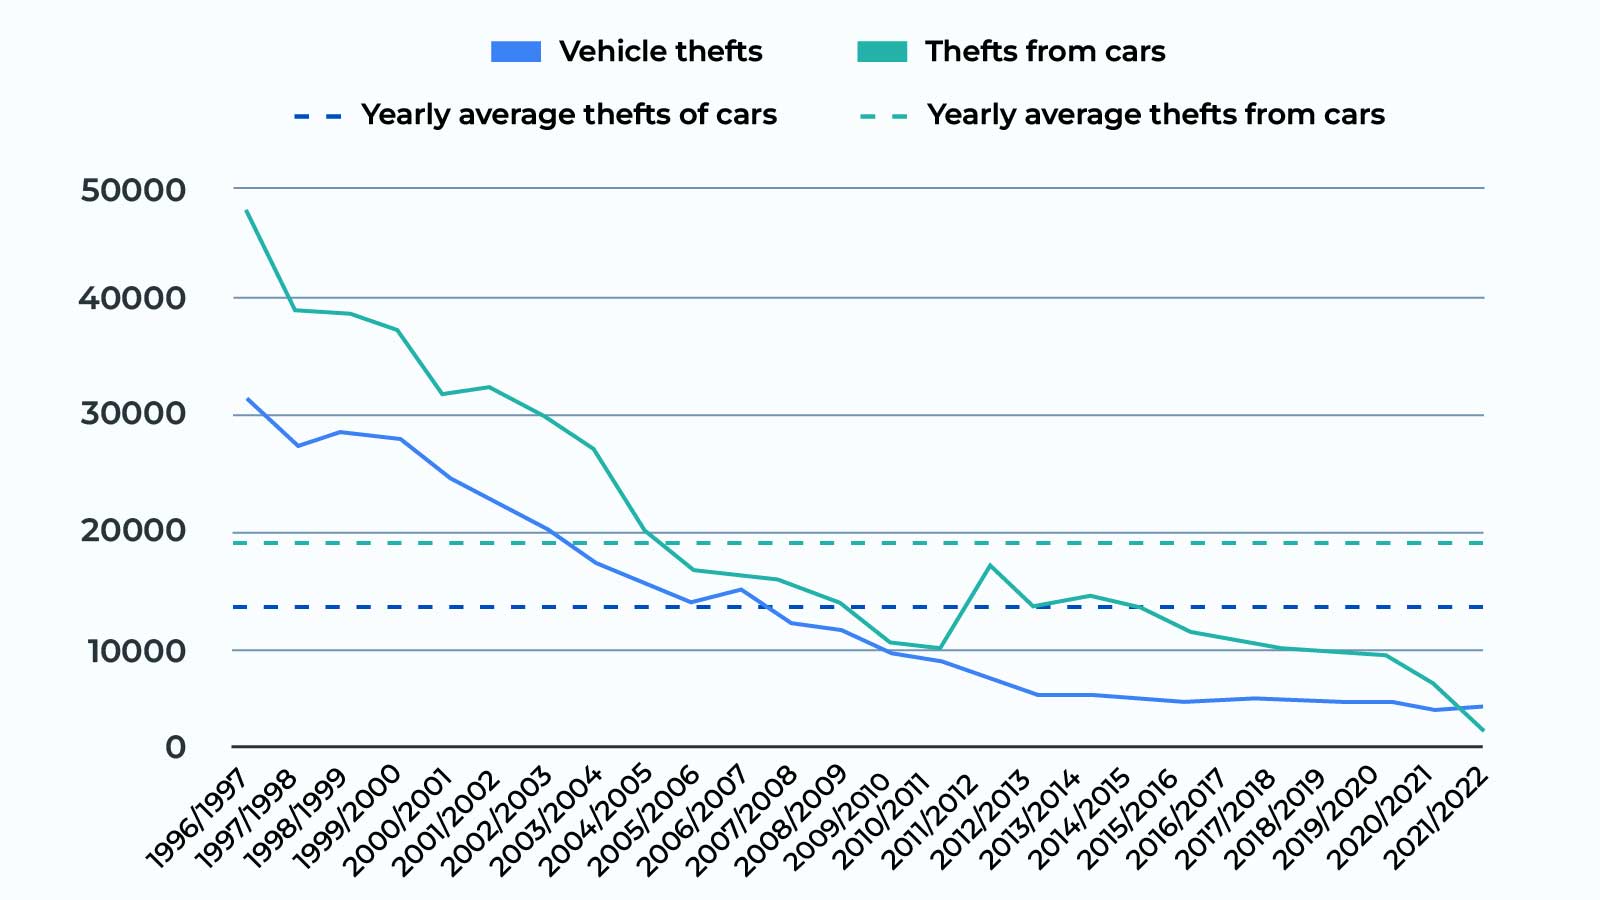
Car thefts have been below the yearly average since 2007/2008, while thefts of valuables by OLP have fallen since 2004/2005, historically showing decreasing trends.
The only genuine concern in the region is that, since 2021/2022, there have been more motor vehicle theft cases than vehicles broken into. Scots lose more vehicles than valuables from inside them.
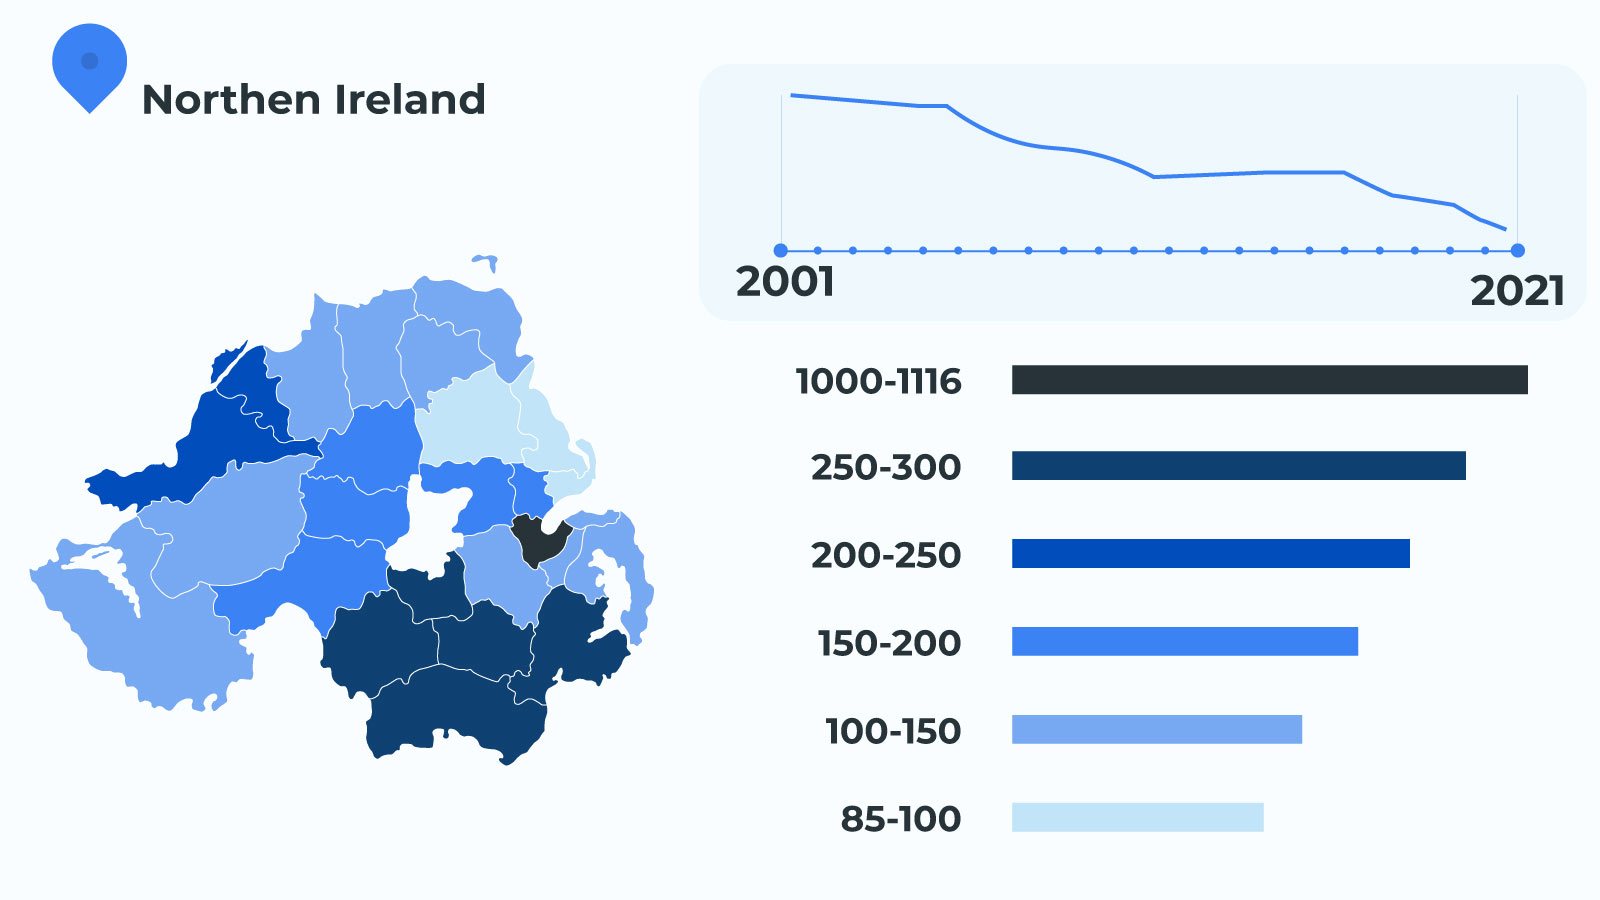
Number of motor vehicle thefts in Northern Ireland
Car thefts in Northern Ireland across the years
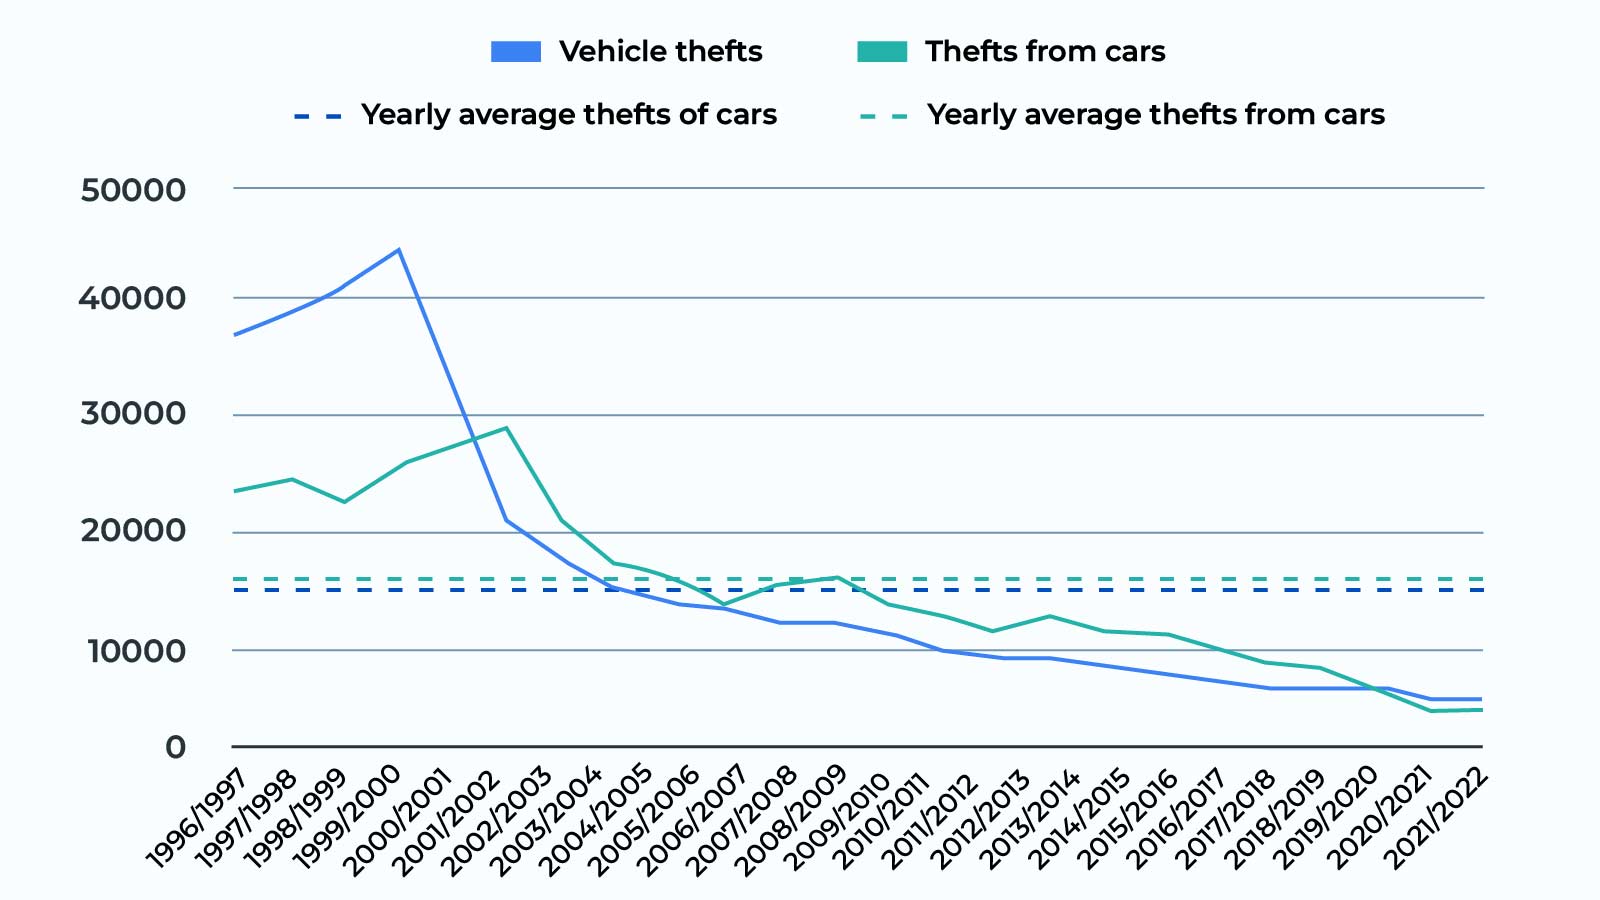
Motor vehicle theft trends in Northern Ireland closely follow those in Scotland, with the rates falling below average between 2004 and 2008 (with a slight jump in 2010).
Similarly, since 2020, car thefts have surpassed thefts from cars, which remained in the current state.
Number of stolen cars in England and Wales
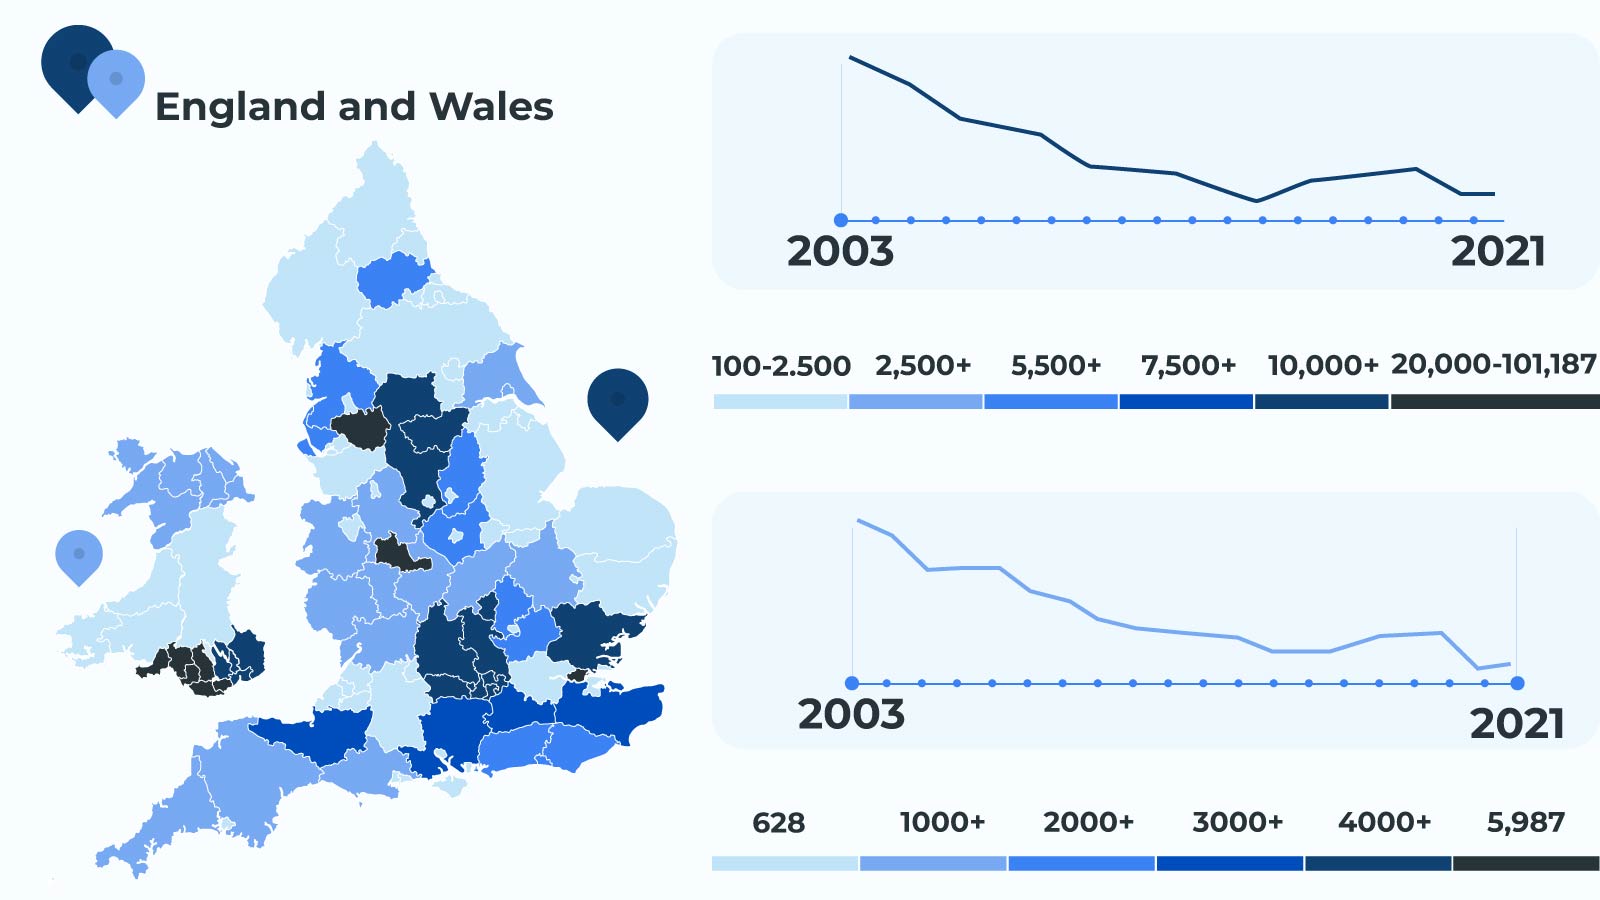
Car thefts in England and Wales across the years
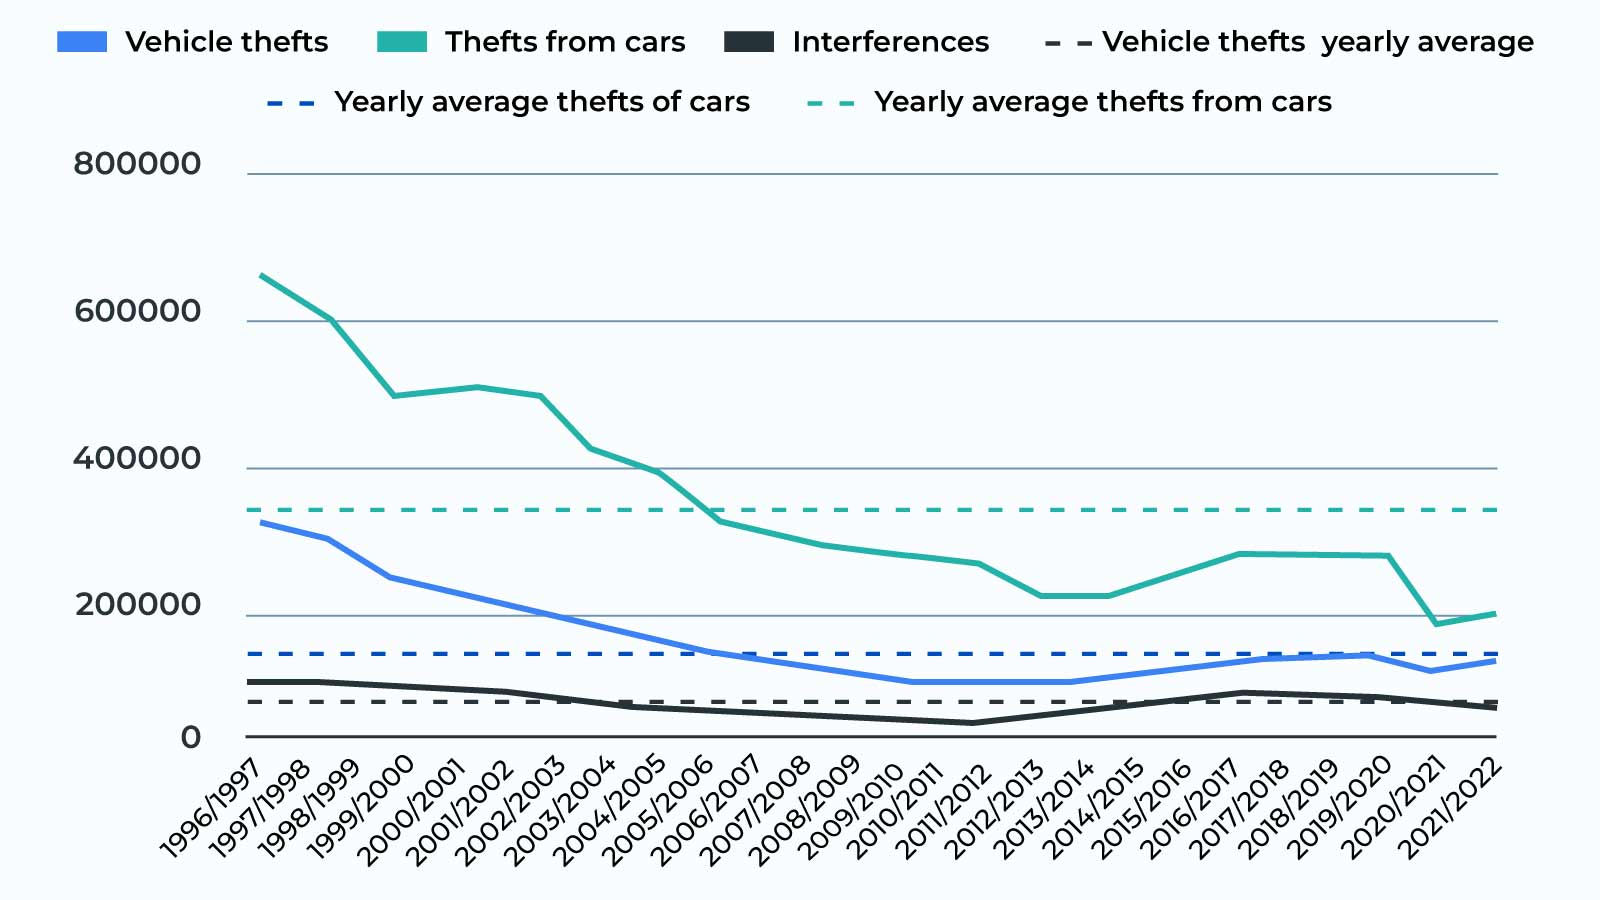
England and Wales are not only the stolen cars UK hotspots but also significantly differ from trends in other regions.
Car thefts and thefts from cars fell below the yearly average slightly later than in other areas. Meanwhile, interferences with a vehicle, ranging from car parts theft to attempts to break in, have undulated around the overall average.
Main takeaway
The rate and number of vehicle thefts in England and Wales have not been as close to the yearly average since 2019.
Comparison of Stolen Cars UK Hotspots
For the local occurrence of most stolen cars, UK police regions are not equal. Some particular sub-regions contribute to the higher rate of vehicle crime more than others.
Share of vehicle crime in England and Wales
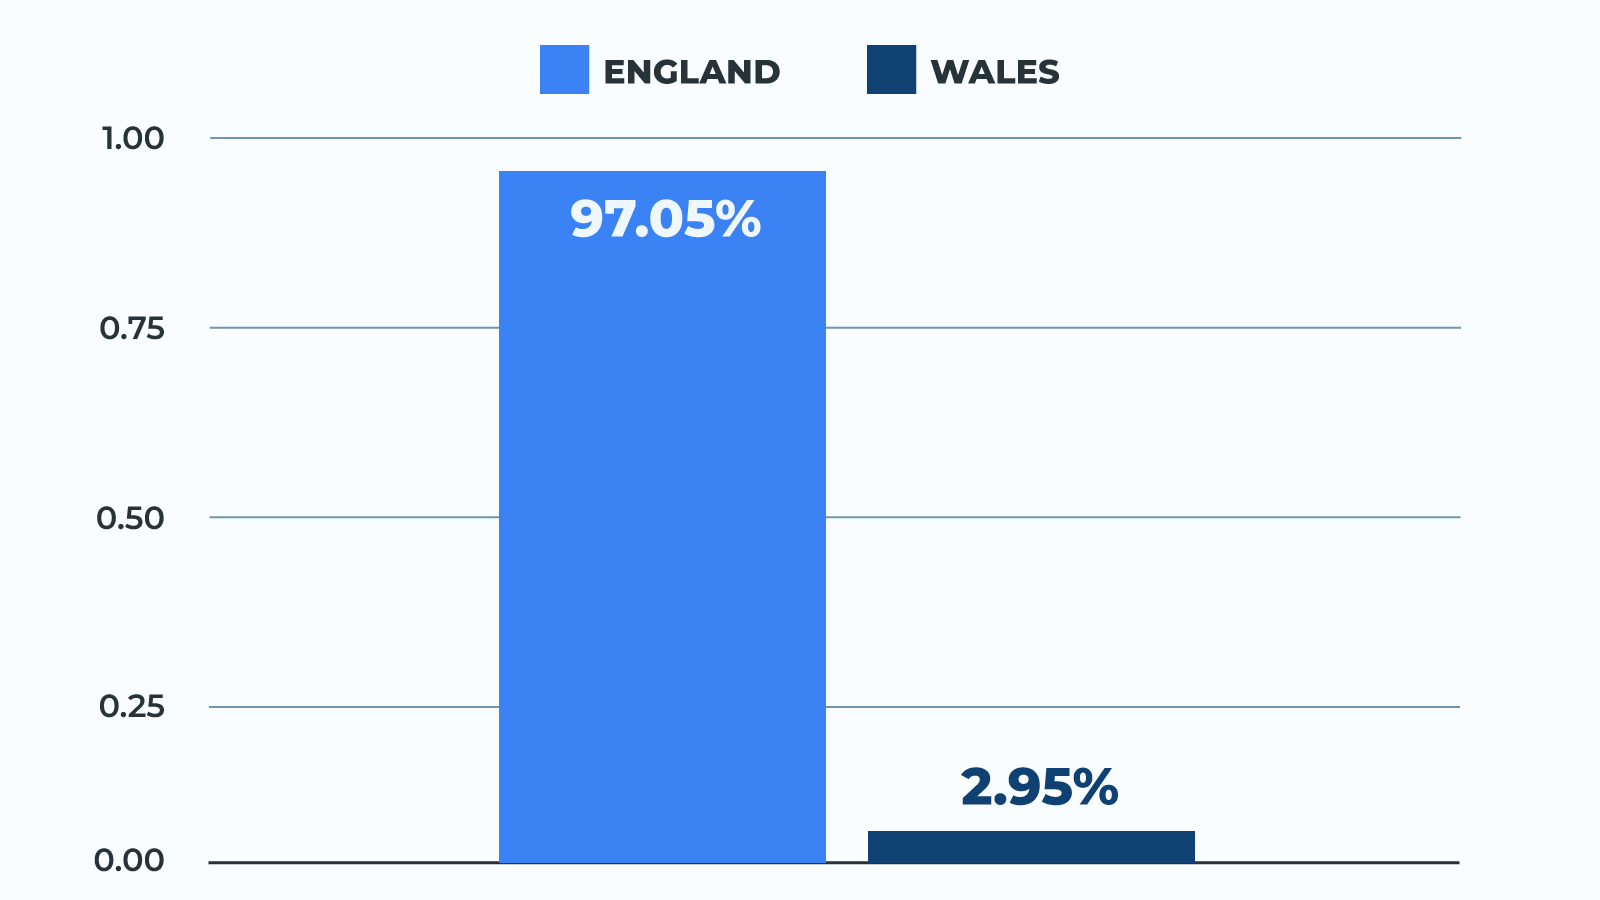
Wales makes up only 2.95% of vehicle crimes in the police region, with England making up the most significant part of all motor vehicle theft cases.
Vehicle crime hotspots in England
Greater regions
| Region | Vehicle crime share |
|---|---|
| London | 31.0% |
| South East | 12.4% |
| North West | 11.6% |
| West Midlands | 11.0% |
| East | 9.3% |
| Yorkshire and the Humber | 8.6% |
| East Midlands | 6.7% |
| South West | 5.9% |
| North East | 3.4% |
Police areas (first 10)
| Area | Share of vehicle crime cases |
|---|---|
| London Metropolitan area | 31.0% |
| West Midlands | 7.8% |
| Greater Manchester | 6.9% |
| West Yorkshire | 4.0% |
| Thames Valley | 3.9% |
| Essex | 3.2% |
| South Yorkshire | 3.1% |
| Kent | 2.6% |
| Avon and Somerset | 2.4% |
| Hampshire | 2.4% |
The first ten hotspots for vehicle theft in England constitute 67.3% of all cases of motor vehicle theft cases in the country.
Top 10 vehicle theft hotspots in Scotland
| Region | Share of vehicle theft cases in Scotland |
|---|---|
| Glasgow City | 18.4% |
| City of Edinburgh | 15.6% |
| North Lanarkshire | 6.4% |
| Dundee City | 6.1% |
| South Lanarkshire | 5.7% |
| Fife | 5.5% |
| Aberdeen City | 4.2% |
| West Lothian | 3.5% |
| West Dunbartonshire | 3.5% |
| Renfrewshire | 3.2% |
The first ten hotspots for vehicle theft in Scotland constitute 72.10% of all cases of motor vehicle theft cases in the country.
Share of stolen cars in Ireland
| Police regions in Northern Ireland | Share of all vehicle theft cases in the country |
|---|---|
| Belfast City | 40.0% |
| Newry Mourne and Down | 10.1% |
| Armagh City Banbridge and Craigavon | 9.3% |
| Derry City and Strabane | 8.4% |
| Antrim and Newtownabbey | 5.5% |
| Mid-Ulster | 5.4% |
| Causeway Coast and Glens | 4.8% |
| Fermanagh and Omagh | 4.8% |
| Lisburn and Castlereagh City | 4.4% |
| Ards and North Down | 4.2% |
| Mid and East Antrim | 3.0% |
The first two hotspots for vehicle theft in Ireland contribute to over 50% of all motor vehicle thefts in Northern Ireland.
When and Where did Car Thefts Occur?
Considering the high number of stolen cars, UK authorities provided some data on the when and where of car theft, which can help you reduce the risks.
When does a motor vehicle theft occur?
Weekdays versus weekends
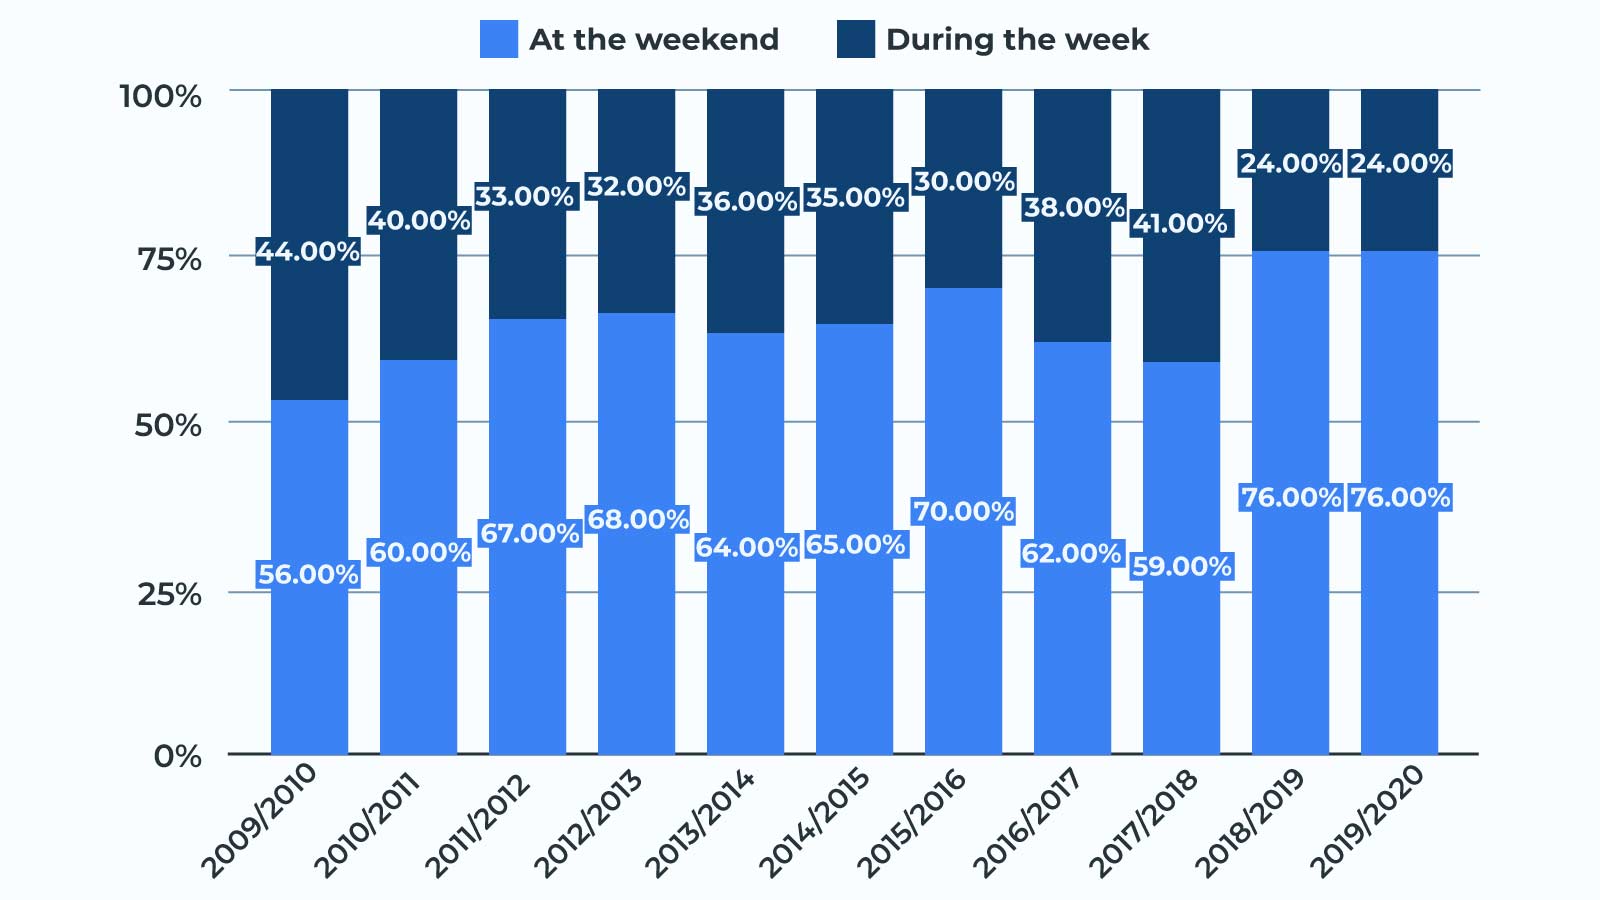
Concerning the time of theft for most stolen cars, UK authorities report that weekdays are riskier overall, with the frequency of occurrence only increasing during the week.
By time of the day
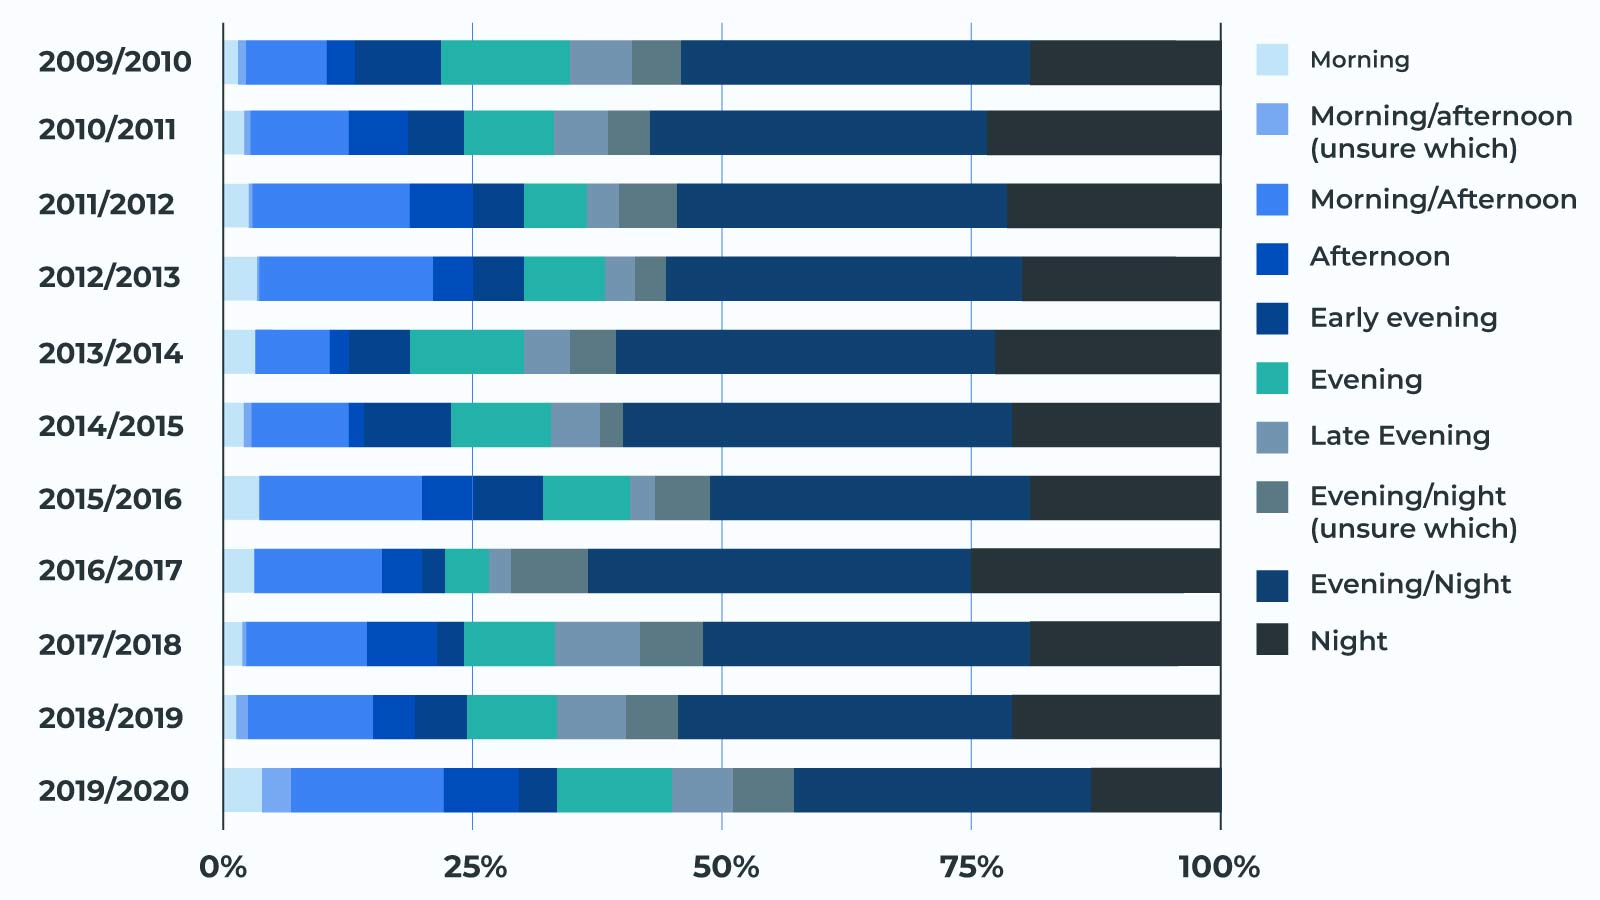
Most motor vehicle theft events occur either during the evening or at night. Less than 50% of all cases are reported to have taken place between the morning and afternoon hours.
By visibility conditions
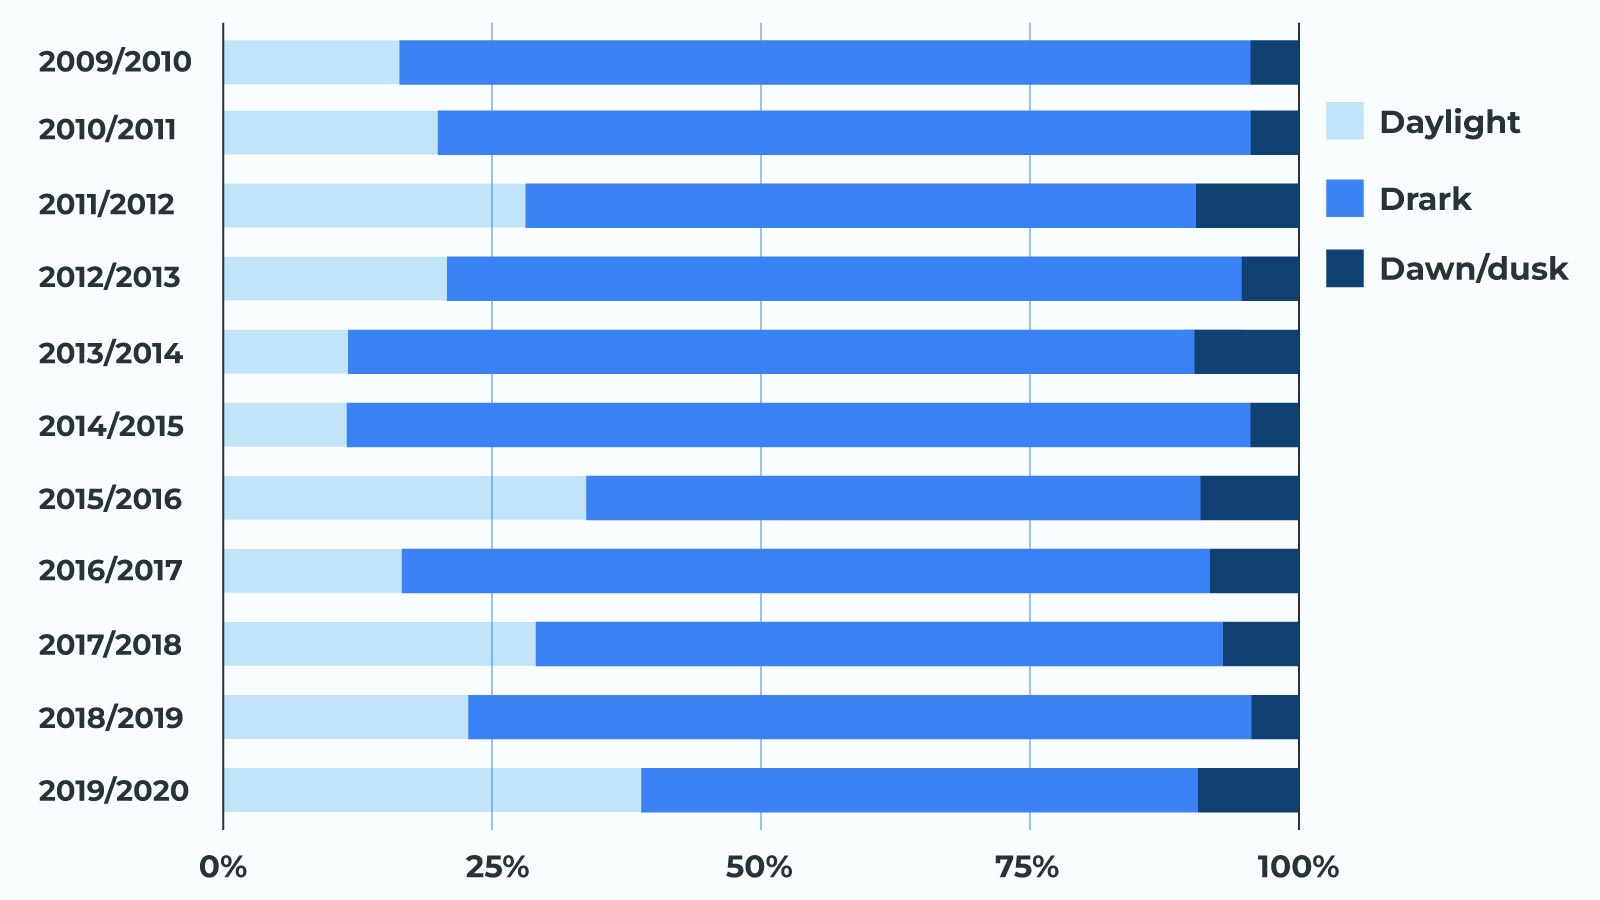
Here, the message is clear. The overwhelming majority of motor vehicle theft in the UK occurs during dark hours.
However, surprisingly, daytime is not the safest time, but rather the transitional dawn or dusk periods.
Where are cars stolen from?
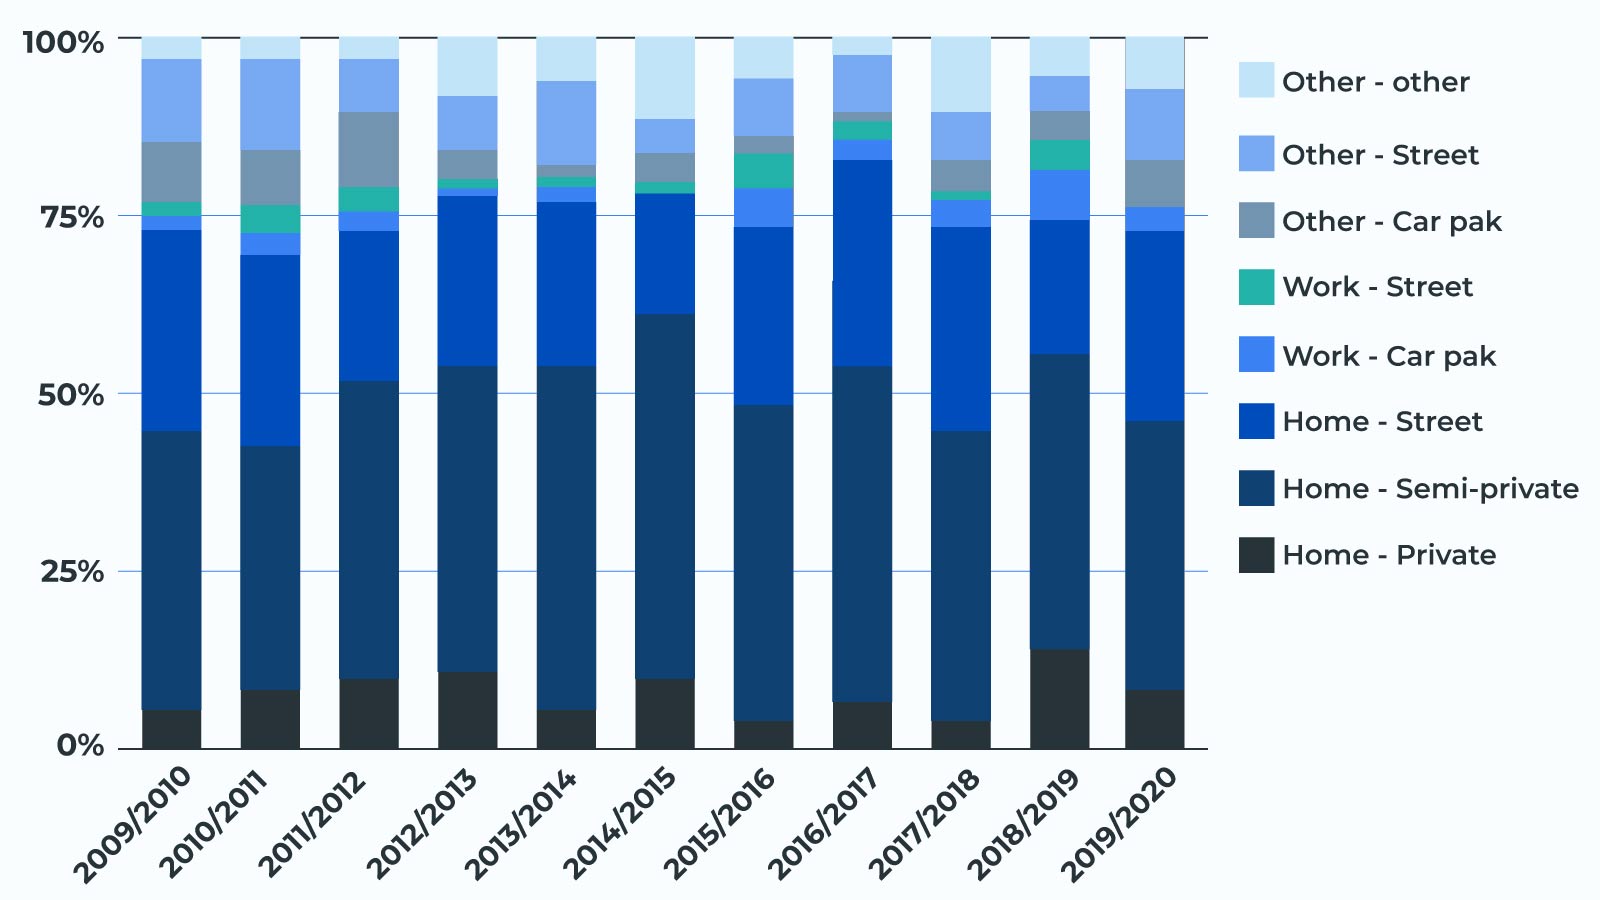
You’re the safest when at work. The greatest share of car theft cases occurs either when parking on the street or in semi-private spaces in residential areas.
Semi-private parking premises include outside areas, garages, or car parks that are not directly connected to a residence.
Just as expected, the most at-risk residents are those who cannot afford a private parking space next to their homes.
Where do thefts from vehicles occur?
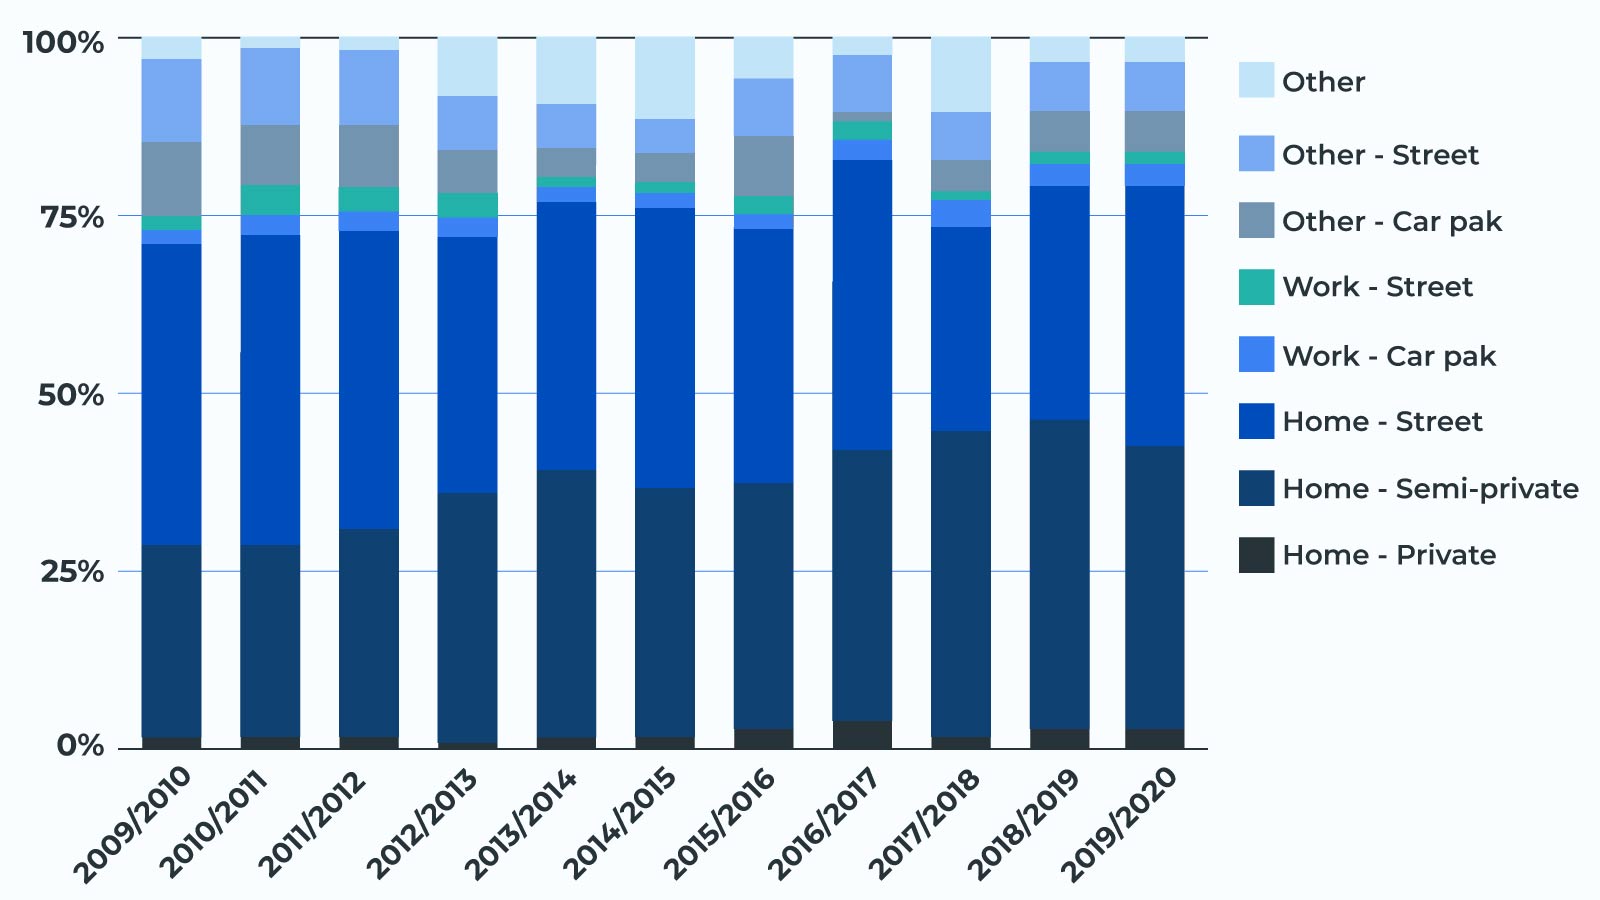
Thefts from cars closely resemble the trends of stolen cars, with most cases occurring in unprotected or partially protected residential parking areas.
How do car thieves proceed?
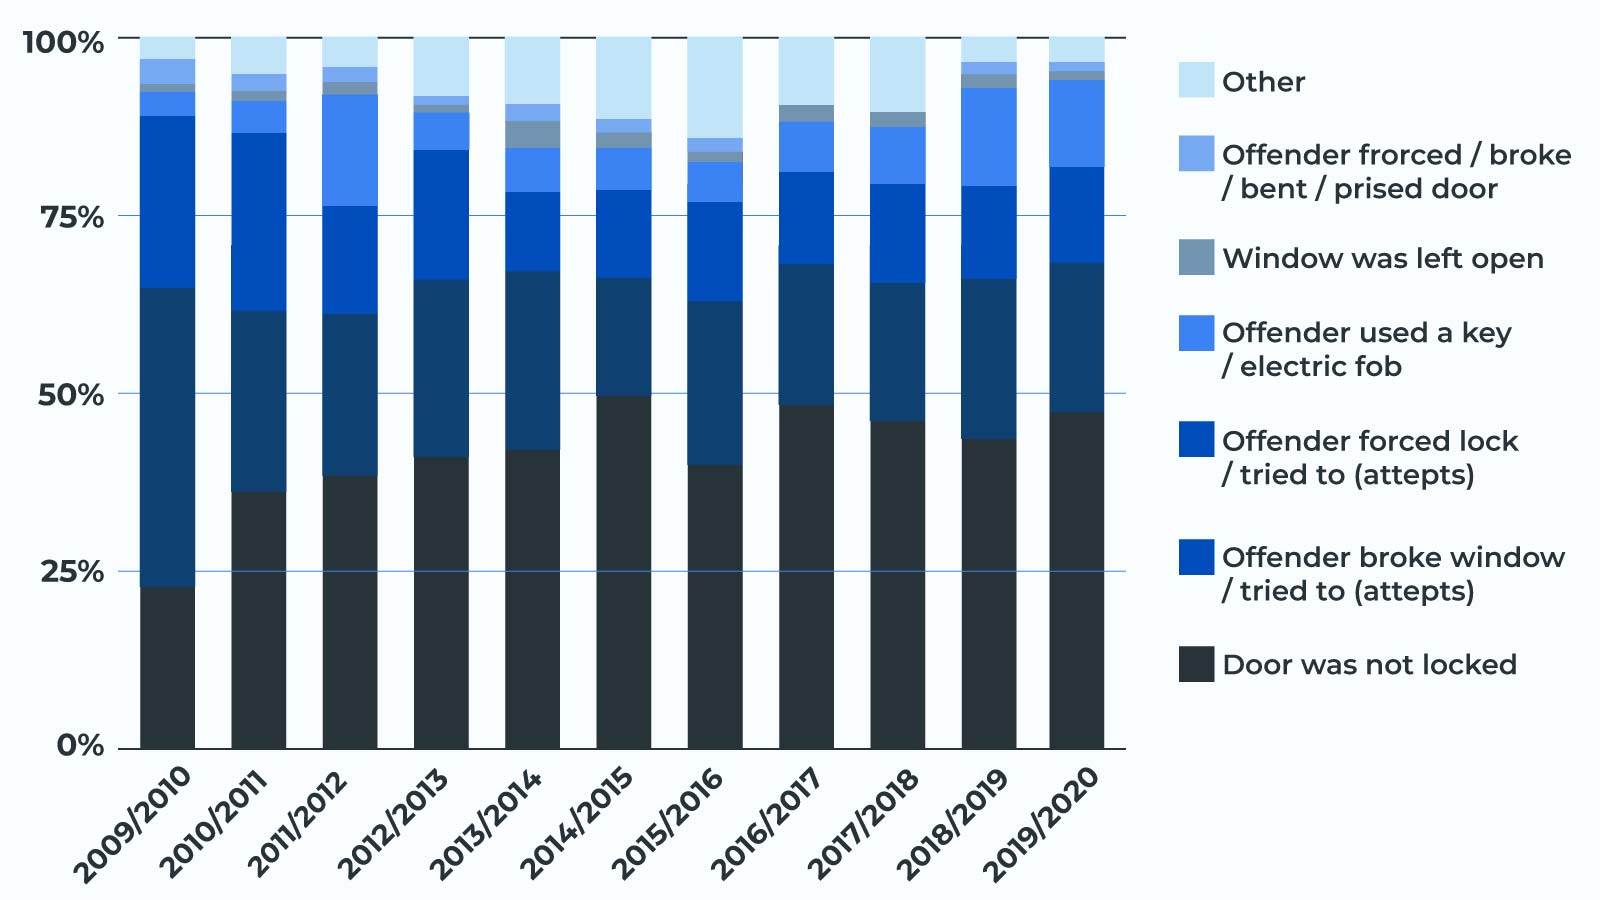
In the case of the stealing process, the methods changed over time. In 2009, breaking the window was the most common approach.
However, with the advent of better security systems, such cases dwindled. Nowadays, car thieves are looking for unlocked vehicles. While it may seem aggravating, remember that the overall number of cases decreased, while that of vehicle theft of cars with open doors remained more or less the same.
Additionally, keyless car theft may be less frequent than previously thought.
Causes of Motor Vehicle Theft in the UK
The leading causes of the high rate of stolen cars in the UK are the advent of keyless vehicle theft systems, car part shortages, and economic hardships.
Additionally, despite the rise in cases, police authorities have failed to catch and prosecute the perpetrators, with a falling recovery rate.
Recovery is one issue, but failure to prosecute is even more aggravating. According to the Ministry of Justice, only 0.6% of perpetrators have been convicted, with 36.49% of them being jailed.
Simply put, car thieves can feel secure in their crimes. The increasing rate of car prices, car part shortages, and new methods of unlocking remote security systems only fuel the fire.
Urban areas are the main hotspots of motor vehicle theft
A higher population density means more cars, greater inequality, and a more difficult time for local police to supervise the entire area effectively.
A growing metropolitan area is rife with higher vehicle theft rates, especially when local authorities fail to respond to the causes and context that allows for their increase.
What are the leading causes?
- The failure to deter, oversee, and resolve car theft cases
- A heightened state of economic hardship in metropolitan areas
- No framework to combat the resale of stolen cars or parts
- Growing demand for car parts and vehicles at a lower price than the legal market
As for the actual risk of losing your car, a higher risk for various models is easily explainable.
Car thieves go for popular models
When looking at the easiest cars to steal, UK statistics point towards models widely owned and driven by British citizens.
The most sold car in the UK
The Vauxhall Corsa was 2024’s best-selling model. It also was the eighth most stolen car in the UK.
You can interpret this relationship in two different ways. A growing number of models led to more motor vehicle thefts, or the higher number of purchases signalled an increasing demand, which was also valid for car thieves.
The most popular cars in the UK
Ford Fiesta is currently the most popular car in the UK. It is also the most stolen. Thus, its higher frequency is not indicative of its risk but rather a consequence of its presence on UK roads.
Additionally, its broad appeal and use incentivise car thieves to learn how to better break into and steal this exact model
Easiest cars to steal, UK 2017-2021
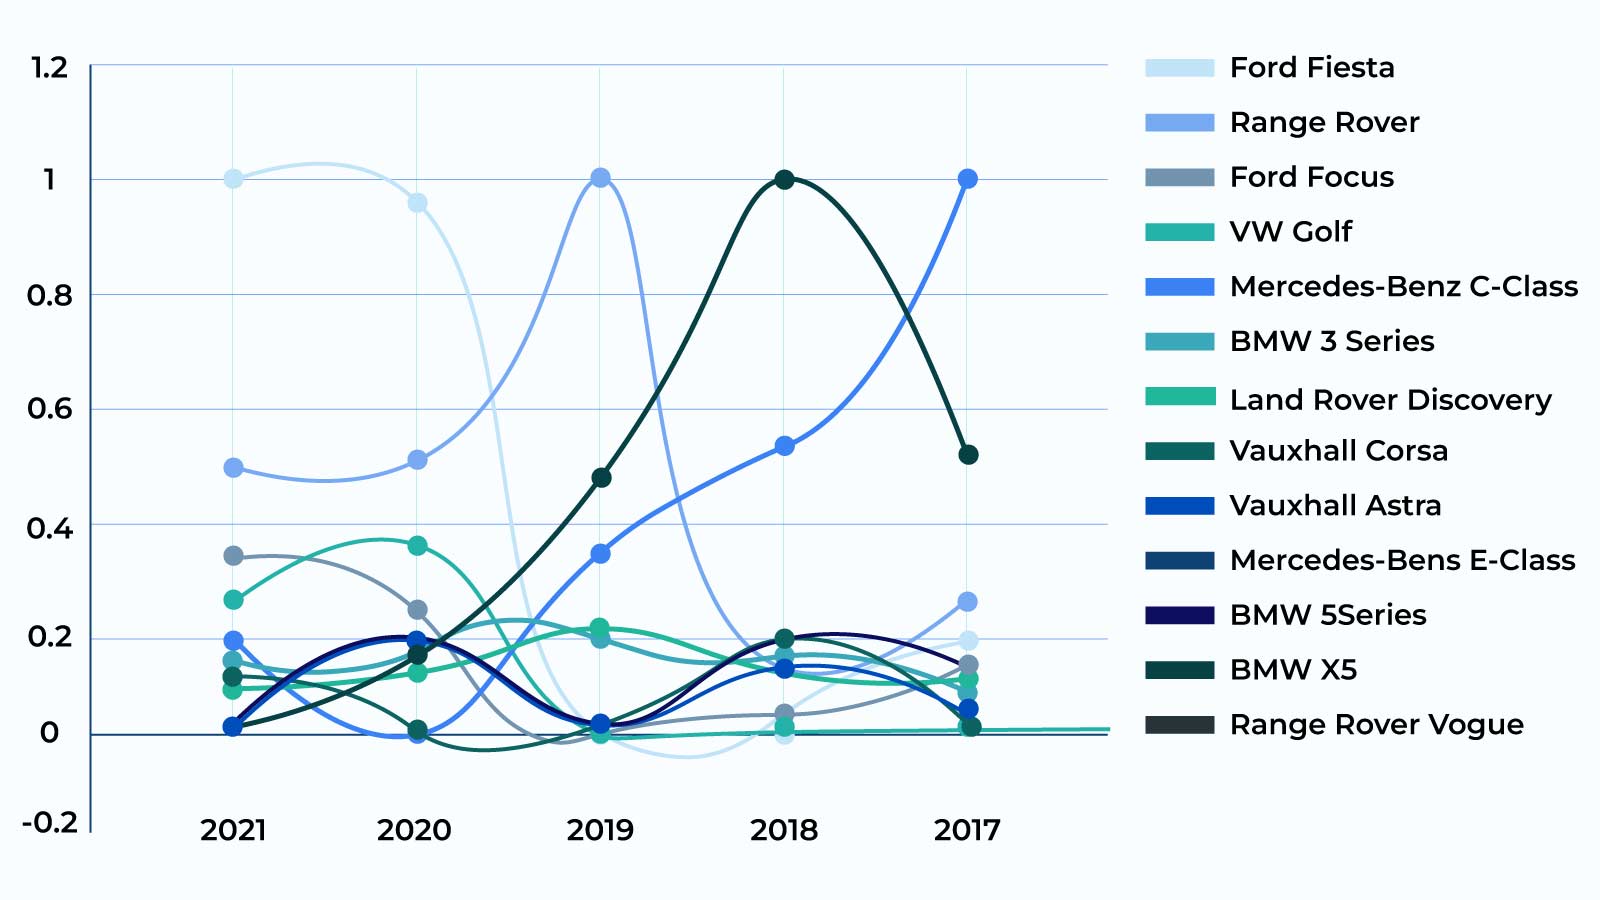
As expected, the most frequently stolen vehicles are also the most popular in Great Britain, the only outliers being Range Rovers and similar SUVs.
In the latter case, there is a strictly monetary incentive that compensates for their rarity, these SUV models racking up a higher price and demand, even on the black market.
What do thieves do with stolen cars in the UK?
Most will attempt to resell the stolen vehicles or strip them down for parts. However, there are many cases in which car thieves would only run the cars until they run out of fuel or cannot be started again.
Essentials for Deterring Car Thefts
- Lock your vehicle and keep your keys safe. Double-check electronic locking systems
- Be aware of potential carjackers and notify the policy when justified
- Look around for illegal tow trucks
- Leave your vehicle in gear and turn your wheels towards the curb to fumble attempts of towing it
- Park your vehicle in a safe area with good visibility. Do not leave valuables in plain sight
- Fit your car with a category 1 or 2 Thatcham-rated alarm system
- Buy a Sold Secure steering wheel, clutch pedal, or gear lever security device
- Lock your engine management diagnostics ports
How to counter keyless car theft
- Keep any spare key in a safe location, preferably in your home
- Place your keys in a signal-blocking pouch or Faraday cage
- Reprogram your keys when buying a second-hand car
- Turn off wireless systems when you don’t use them
Tips from trusted sources
The recommendations we provided come from an official report from the UK Metropolitan Police. We advise you to listen to trusted sources and authorities when securing your car.
Security precautions for vehicles implicated in all theft cases
Methodology of Car Theft Statistics UK
Our contributors started their investigation of the most stolen cars UK odds and statistics by consulting the data published by British authorities and trusted sources.
Our objective
The final report aimed to inform and educate the reader on the possible risks of car theft across the UK. Its limitations are stated across the piece. The odds are not exact, and the future development of a sensitive issue such as criminality in Great Britain cannot be accounted for.
Thus, our main intention is to uphold the efforts of knowledgeable authorities in investigating and finding a resolution for current social ills. Under no circumstances can we provide comprehensive policies around contentious issues.
However, we can contribute to a better Great Britain by providing verifiable data in reader-friendly curated reports.
Are you interested in reading more articles about different odds?
Our team of experts has dedicated long hours to analysing the odds of different possible events and circumstances which could be of interest to our British public. If this is something you are passionate about as well, we recommend you to check out our extensive analyses on completing the London marathon, or our page, which offers details on the odds of winning the lottery.
Our methods
While our primary expertise is derived from studying the dynamics of the UK market of online casinos, we are trained in studying more complex issues. Statistical experts have computed all the data we provide and thoroughly verified it by legal advisors.
We constantly update our published content to reflect the current state of a specific issue or situation. You can expect to see changes in data and conclusions as soon as officially sourced information is deemed necessary.
References
- Crime in England and Wales: Police Force Area data tables
- Overview of vehicle-related theft: England and Wales
- Scottish Government – Recorded Crime in Scotland, 2020-2021
- Metropolitan Police – Preventing car and vehicle theft
- Most popular cars on the road – What is the most common car in the UK?
- Thatcham Research
- How Many Left
- Average Cost to Run a Car UK 2022
- Crime in England and Wales: Appendix tables
- Northern Ireland Statistics and Research Agency